Supplemental Videos
The main topics of this section are also presented in the following videos:
The main topics of this section are also presented in the following videos:
In this section, we explore how certain changes in the formula for a function affect its graph. In particular, we will compare the graph of \(y = f (x)\) with the graphs of
for different values of the constants \(k\) and \(h\text{.}\) Such variations are called transformations of the graph.
Figure242 shows the graphs of \(f (x) = x^2 + 4\text{,}\) \(g(x) = x^2 - 4\text{,}\) and the basic parabola, \(y = x^2\text{.}\) By comparing tables of values, we can see exactly how the graphs of \(f\) and \(g\) are related to the basic parabola.

Vertical Shift
\(x\)
\(-2\)
\(-1\)
\(~0~\)
\(~~1~~\)
\(~2~\)
\(y=x^2\)
\(4\)
\(1\)
\(0\)
\(1\)
\(4\)
\(f(x)=x^2+4\)
\(8\)
\(5\)
\(4\)
\(5\)
\(8\)
\(x\)
\(-2\)
\(-1\)
\(0\)
\(1\)
\(2\)
\(y=x^2\)
\(4\)
\(1\)
\(0\)
\(1\)
\(4\)
\(g(x)=x^2-4\)
\(0\)
\(-3\)
\(-4\)
\(-3\)
\(0\)
Each \(y\)-value in the table for \(f (x)\) is four units greater than the corresponding \(y\)-value for the basic parabola \(y=x^2 \text{.}\) Consequently, each point on the graph of \(f (x)\) is four units higher than the corresponding point on the basic parabola, as shown by the arrows. Similarly, each point on the graph of \(g(x)\) is four units lower than the corresponding point on the basic parabola.
The graphs of \(y = f (x)\) and \(y = g(x)\) are said to be translations (or shifts) of the graph of \(y = x^2\text{.}\) They are shifted to a different location in the plane but retain the same size and shape as the original graph. In general, we have the following principles.
Let \(k\gt 0\text{.}\) Compared with the graph of \(y = f (x)\text{,}\)
Graph the following functions.
The table shows that the \(y\)-values for \(g(x)\) are each three units greater than the corresponding \(y\)-values for the absolute value function. The graph of \(g(x) = \abs{x} + 3\) is a translation of the basic graph of \(y = \abs{x}\text{,}\) shifted upward three units, as shown in Figure244.

| \(x\) | \(-2\) | \(-1\) | \(0\) | \(1\) | \(2\) |
| \(y=\abs{x}\) | \(2\) | \(1\) | \(0\) | \(1\) | \(2\) |
| \(g(x)=\abs{x}+3\) | \(5\) | \(4\) | \(3\) | \(4\) | \(5\) |
The table shows that the \(y\)-values for \(h(x)\) are each two units smaller than the corresponding \(y\)-values for \(y = \dfrac{1}{x}\text{.}\) The graph of \(h(x) = \dfrac{1}{x} - 2\) is a translation of the basic graph of \(y = \dfrac{1}{x}\text{,}\) shifted downward two units, as shown in Figure245.

| \(x\) | \(-2\) | \(-1\) | \(\dfrac{1}{2}\) | \(1\) | \(2\) |
| \(y=\dfrac{1}{x}\) | \(\dfrac{-1}{2}\) | \(-1\) | \(2\) | \(1\) | \(\dfrac{1}{2}\) |
| \(h(x)=\dfrac{1}{x}-2\) | \(\dfrac{-5}{2}\) | \(-3\) | \(0\) | \(-1\) | \(\dfrac{-3}{2}\) |
The function \(E = f (h)\) graphed in Figure247 gives the amount of electrical power, in megawatts, drawn by a community from its local power plant as a function of time during a 24-hour period in 2002. Sketch a graph of \(y = f (h) + 300\) and interpret its meaning.

The graph of \(y = f (h) + 300\) is a vertical translation of the graph of \(f\text{,}\)
as shown in Figure248. At each hour of the day, or for each value of \(h\text{,}\) the \(y\)-coordinate is 300 greater than on the graph of \(f\text{.}\) So at each hour, the community is drawing 300 megawatts more power than in 2002.

An evaporative cooler, or swamp cooler, is an energy-efficient type of air conditioner used in dry climates. A typical swamp cooler can reduce the temperature inside a house by 15 degrees. Figure250a shows the graph of \(T = f (t)\text{,}\) the temperature inside Kate's house \(t\) hours after she turns on the swamp cooler. Write a formula in terms of \(f\) for the function \(g\) shown in Figure250b and, give a possible explanation of its meaning.

The graph of \(g\) is a vertical translation of \(f\text{,}\) \(10\) units up. Therefore \(g(t) = f (t) + 10\text{.}\) Its meaning could be that it measures the same thing as \(f\) but that the outside temperature was \(10\degree\) hotter.
Now consider the graphs of \(f (x) = (x + 2)^2\) and \(g(x) = (x - 2)^2\) shown in Figure251. Compared with the graph of the basic function \(y = x^2\text{,}\) the graph of \(f (x) = (x + 2)^2\) is shifted two units to the left, as shown by the arrows. You can see why this happens by studying the function values in the table.

Locate a particular \(y\)-value for \(y = x^2\text{,}\) say, \(y = 4\text{.}\) You must move two units to the left in the table to find the same \(y\)-value for \(f (x)\text{,}\) as shown by the arrow. In fact, each \(y\)-value for \(f (x)\) occurs two units to the left when compared to the same \(y\)-value for \(y = x^2\text{.}\)


Similarly, the graph of \(g(x) = (x - 2)^2\) is shifted two units to the right compared to the graph of \(y = x^2\text{.}\) In the table for \(g\text{,}\) each \(y\)-value for \(g(x)\) occurs two units to the right of the same \(y\)-value for \(y = x^2\text{.}\) In general, we have the following principle.
Let \(h\gt 0\text{.}\) Compared with the graph of \(y = f (x)\text{,}\)
At first, the direction of a horizontal translation may seem counterintuitive. Look again at the tables above to help you see how the shift occurs.
Graph the following functions.
Consider the table of values for the function.
| \(x\) | \(-1\) | \(0\) | \(1\) | \(2\) | \(3\) |
| \(y=\sqrt{x}\) | undefined | \(0\) | \(1\) | \(1.414\) | \(1.732\) |
| \(y=\sqrt{x+1}\) | \(0\) | \(1\) | \(1.414\) | \(1.732\) | \(2\) |
The table shows that each \(y\)-value for \(g(x)\) occurs one unit to the left of the same \(y\)-value for the graph of \(y=\sqrt{x}\text{.}\) Consequently, each point on the graph of \(y = g(x)\) is shifted one unit to the left of \(y =\sqrt{x}\text{,}\) as shown in Figure256.

Consider the table of values for the function.
| \(x\) | \(-1\) | \(0\) | \(1\) | \(2\) | \(3\) | \(4\) |
| \(y=\dfrac{1}{x}\) | \(1\) | undefined | \(1\) | \(\dfrac{1}{4}\) | \(\dfrac{1}{9}\) | \(\dfrac{1}{16}\) |
| \(y=\dfrac{1}{(x-3)^2}\) | \(\dfrac{1}{16}\) | \(\dfrac{1}{9}\) | \(\dfrac{1}{4}\) | \(1\) | undefined | \(1\) |
The table shows that each \(y\)-value for \(h(x)\) occurs three units to the right of the same \(y\)-value for the graph of \(y =\dfrac{1}{x^2}\text{.}\) Consequently, each point on the graph of \(y = h(x)\) is shifted three units to the right of \(y =\dfrac{1}{x^2}\text{,}\) as shown in Figure257.

The function \(N = f (p)\) graphed in Figure259 gives the number of people who have a given eye pressure level \(p\) measured in millimeters of mercury (mm Hg) from a sample of 100 people with healthy eyes, and the function \(g\) gives the number of people with pressure level \(p\) in a sample of 100 glaucoma patients.

The function \(C = f (t)\) in Figure261 gives the caffeine level in Delbert's bloodstream at time \(t\) hours after he drinks a cup of coffee, and \(g(t)\) gives the caffeine level in Francine's bloodstream. Write a formula for \(g\) in terms of \(f\text{,}\) and explain what it tells you about Delbert and Francine.

The graph of \(g\) is a horizontal translation of \(f\text{;}\) it appears to have been shifted about \(3\) units to the right. Thus \(g(t) = f (t - 3)\text{.}\) This could be because Francine drank her coffee \(3\) hours after Delbert drank his.
Graph \(f (x) = (x + 4)^3 + 2\text{.}\)
We identify the basic graph from the structure of the formula for \(f (x)\text{.}\) In this case, the basic graph is \(y = x^3\text{,}\) so we begin by locating a few points on that graph, as shown in Figure263.
We will perform the translations separately, following the order of operations. First, we sketch a graph of \(y = (x + 4)^3\) by shifting each point on the basic graph four units to the left. We then move each point up two units to obtain the graph of \(f (x) = (x + 4)^3 + 2\text{.}\) All three graphs are shown in Figure263.

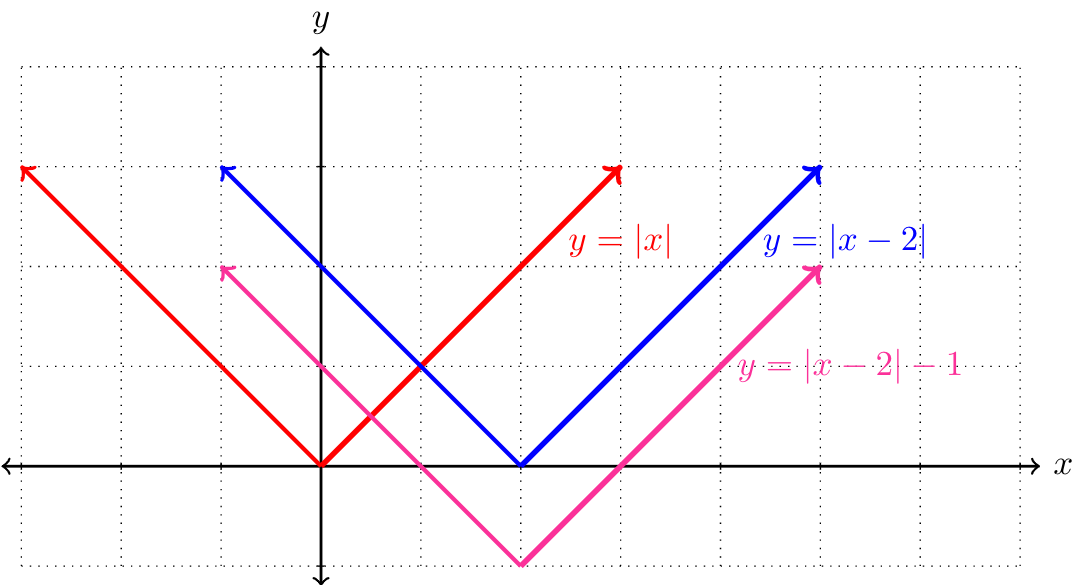
We begin by graphing \(y=|x|\text{,}\) shifting it \(2\) units to the right to obtain \(y=|x-2|\text{,}\) and then shifting it \(1\) unit down to obtain \(y=|x-2|-1\text{.}\)