SubsectionMeaning of Slope
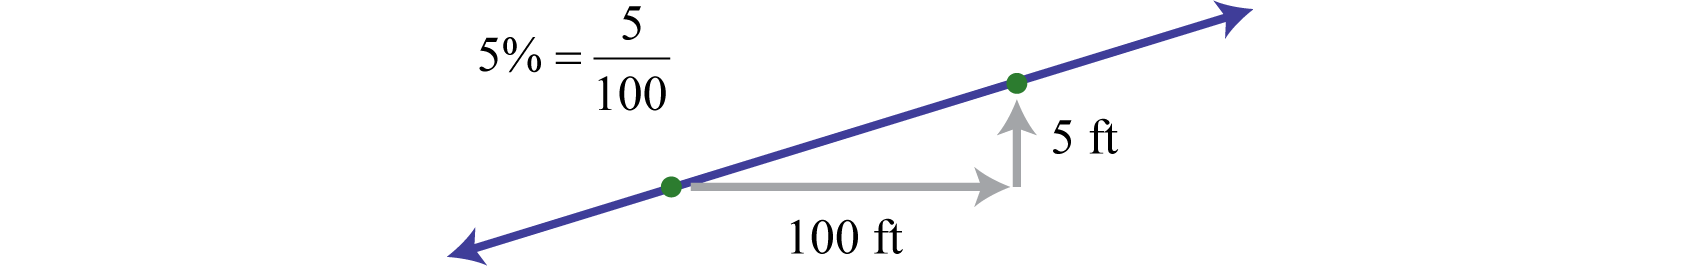
The steepness of any incline can be measured as the ratio of the vertical change to the horizontal change. For example, a \(5\)% incline can be written as \(\frac{5}{100}\text{,}\) which means that for every 100 feet forward, the height increases 5 feet.
In mathematics, we call the incline of a line the slope, denoted by the letter \(m\text{.}\) The vertical change is called the rise and the horizontal change is called the run. Given any two points \((x_1,y_1)\) and \((x_2,y_2)\text{,}\) we can obtain the rise and run by subtracting the corresponding coordinates.
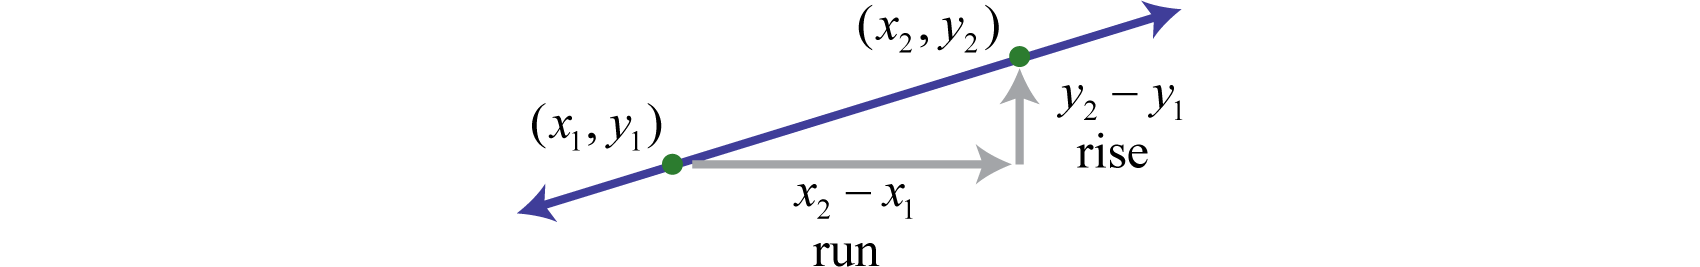
This leads us to the slope formula. Given any two points \((x_1,y_1)\) and \((x_2,y_2)\text{,}\) the slope is given by the following formula:
\begin{gather*}
\alert{\text{Slope }}= m=\frac{rise}{run}=\frac{y_2-y_1}{x_2-x_1}=\frac{\Delta y}{\Delta x}= \alert{\frac{\text{Change in }y}{\text{Change in }x}}\text{.}
\end{gather*}
The Greek letter delta \((\Delta)\) is often used to describe the change in a quantity. Therefore, the slope is sometimes described using the notation \(\frac{\Delta y}{\Delta x}\text{,}\) which represents the change in \(y\) divided by the change in \(x\text{.}\)
Example82
Find the slope of the line passing through \((-3, -5)\) and \((2, 1)\text{.}\)
SolutionGiven \((-3, -5)\) and \((2, 1)\text{,}\) calculate the difference of the \(y\)-values divided by the difference of the \(x\)-values. Take care to be consistent when subtracting the coordinates.
Let \((x_1,y_1)=(-3,-5)\) and \((x_2,y_2)=(2,1)\text{.}\)
\begin{equation*}
\begin{aligned}
m\amp = \frac{y_2-y_1}{x_2-x_1}\\
\amp =\frac{1-(-5)}{2-(-3)}\\
\amp =\frac{1+5}{2+3}\\
\amp =\frac{6}{5}
\end{aligned}
\end{equation*}
The slope is given by \(m=\frac{6}{5}\text{.}\)
It does not matter which point you consider to be the first and second when calculating slope. However, because subtraction is not commutative, you must take care to subtract the coordinates of the first point from the coordinates of the second point in the same order. To demonstrate this we obtain the same result in the example above if we apply the slope formula with the points switched.
Let \((x_1,y_1)=(2,1)\) and \((x_2,y_2)=(-3,-5)\text{.}\)
\begin{equation*}
\begin{aligned}
m\amp = \frac{y_2-y_1}{x_2-x_1}\\
\amp =\frac{-5-1}{-3-2}\\
\amp =\frac{-6}{-5}\\
\amp =\frac{6}{5}
\end{aligned}
\end{equation*}
We can verify that the slope is \(\frac{6}{5}\) by graphing the linear equation described in the previous example.
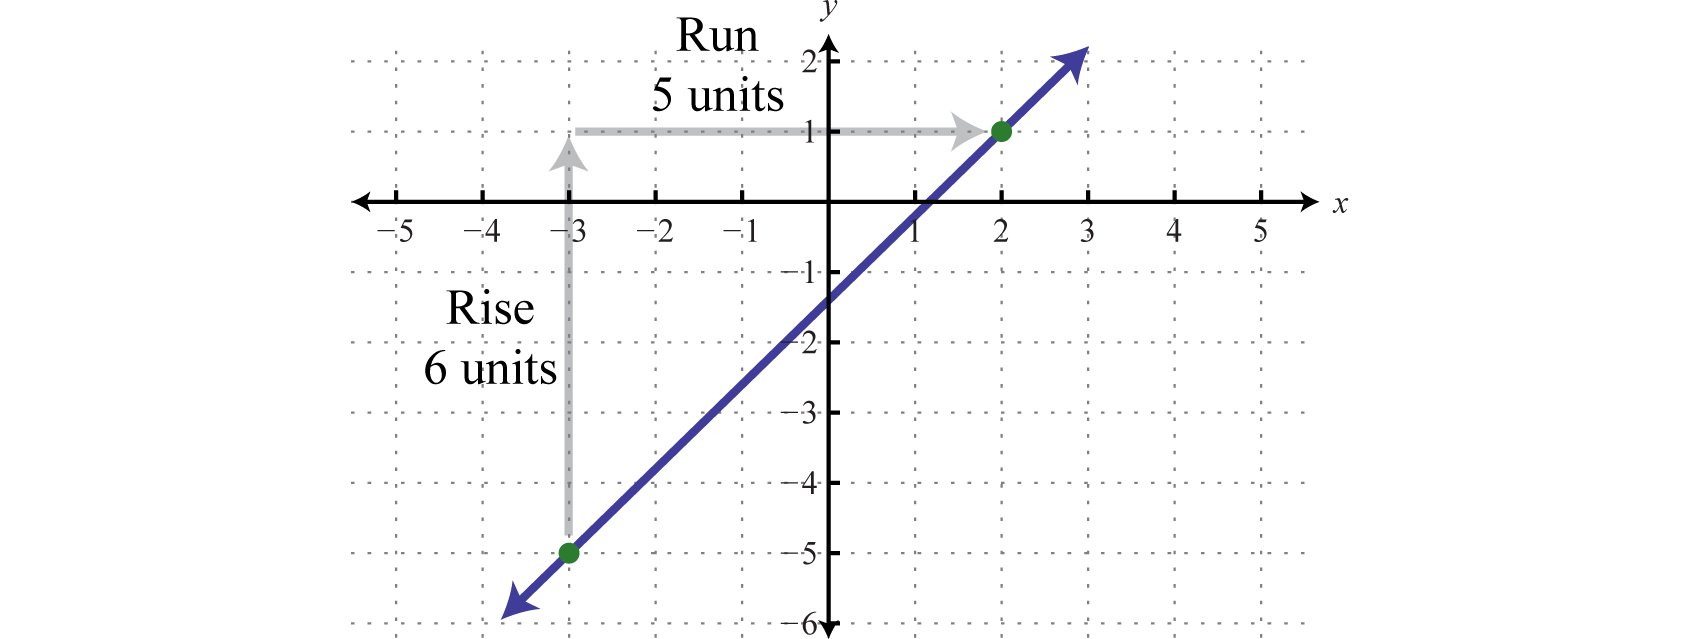
Certainly the graph is optional - the beauty of the slope formula is that, given any two points, we can obtain the slope using only algebra.
Example83
Find the \(y\)-value for which the slope of the line passing through \((6,-3)\) and \((-9,y)\) is \(-\frac{2}{3}\text{.}\)
SolutionSubstitute the given information into the slope formula.
We have \(m=-\frac{2}{3}\) and we can let \((x_1,y_1)=(6,-3)\) and \((x_2,y_2)=(-9,y)\text{.}\)
\begin{equation*}
\begin{aligned}
m\amp = \frac{y_2-y_1}{x_2-x_1}\\
-\frac{2}{3}\amp=\frac{y-(-3)}{-9-6}\\
-\frac{2}{3}\amp=\frac{y+3}{-15}\\
\end{aligned}
\end{equation*}
After substituting in the given information, the only variable left is \(y\text{.}\) Solve for \(y\text{.}\)
\begin{equation*}
\begin{aligned}
\alert{-15}\left(-\frac{2}{3}\right)\amp = \alert{-15}\left(-\frac{y+3}{15}\right)\\
10\amp = y+3\\
7\amp = y
\end{aligned}
\end{equation*}
The \(y\)-value which satisfies the conditions above is \(y=7\text{.}\)
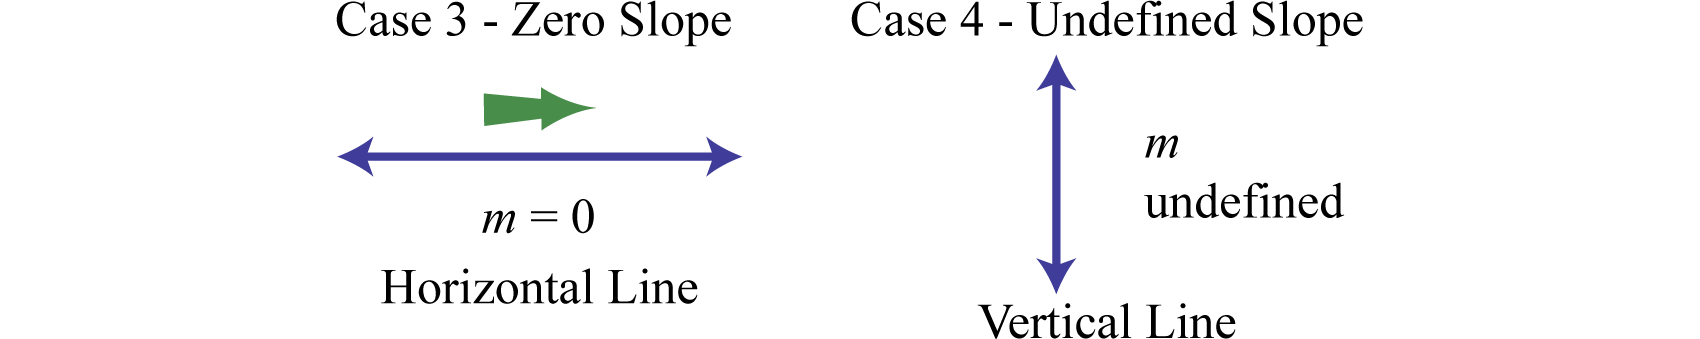
There are four geometric cases for the value of the slope.
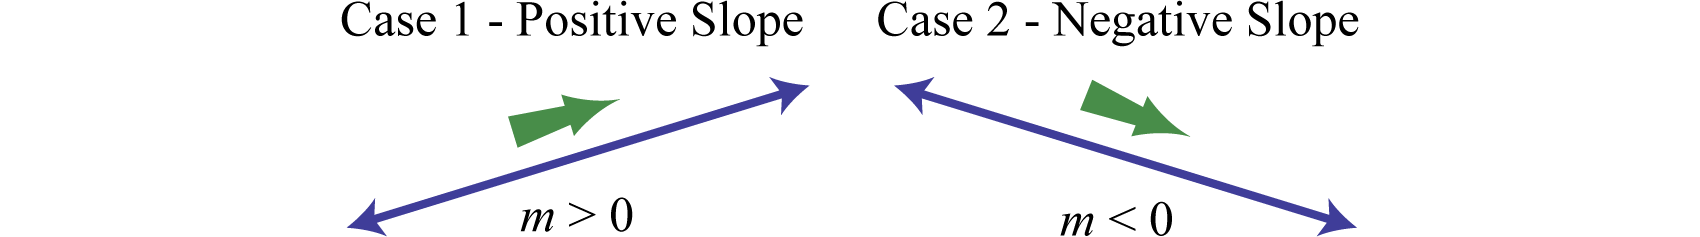
Reading the graph from left to right, lines with an upward incline have positive slopes and lines with a downward incline have negative slopes. The other two cases involve horizontal and vertical lines. If \(c\) is a real number we have
\begin{align*}
y\amp =c \text{ whose graph is a } \alert{\text{horizontal line.}}\\
x\amp =c \text{ whose graph is a } \alert{\text{vertical line.}}
\end{align*}
For example, if we graph \(y=2\) we obtain a horizontal line, and if we graph \(x=-4\) we obtain a vertical line.
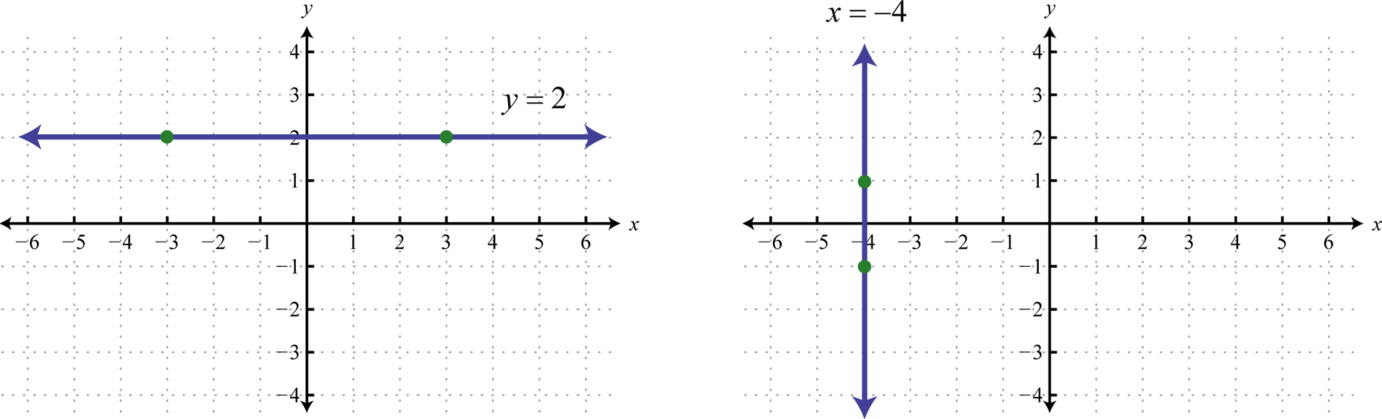
From the graphs we can determine two points and calculate the slope using the slope formula.
| Horizontal Line |
Vertical Line |
| Let \((x_1,y_1)=(-3,2)\) and \((x_2,y_2)=(3,2)\text{.}\)
\begin{align*}
m\amp = \frac{y_2-y_1}{x_2-x_1}\\
\amp = \frac{2-(2)}{3-(-3)}\\
\amp=\frac{2-2}{3+3}\\
\amp =\frac{0}{6}=0
\end{align*}
|
Let \((x_1,y_1)=(-4,-1)\) and \((x_2,y_2)=(-4,1)\text{.}\)
\begin{align*}
m\amp = \frac{y_2-y_1}{x_2-x_1}\\
\amp = \frac{1-(-1)}{-4-(-4)}\\
\amp=\frac{1+1}{-4+4}\\
\amp =\frac{2}{0} \, \, \alert{\text{Undefined}}
\end{align*}
|
Notice that the points on the horizontal line share the same \(y\)-values. Therefore, the rise is zero and hence the slope is zero. The points on the vertical line share the same \(x\)-values. Consequently, the run is zero, leading to an undefined slope. These give us the last two cases.
SubsectionAverage Rate of Change
When a real world situation can be represented by a linear equation, the slope of the line is sometimes called the average rate of change. For example, suppose we graphed the distance (in miles) that a car drives over time (in hours). If the car drives at a consistent speed then it would form a straight line. The slope of this line would measure the average rate of change of the car's distance relative to time; in other words, the slope measures the speed of the car.
Consider the equation \(C=4+2t\) representing the cost of a movie rental in terms of the number of days of the rental. If we graph this equation, we can choose any two points on the line to compute its slope. For example, if we choose the points \((0,4)\) and \((4,12)\) then we have the following slope.
\begin{equation*}
m=\frac{12-4}{4-0}=\frac{8}{4}=2
\end{equation*}
The slope of the line is \(2\text{.}\) In terms of renting a movie, our slope expression is telling us
\begin{equation*}
\frac{\text{Change in Cost}}{\text{Change in Time}}=\frac{8 \text{ dollars}}{4 \text{ days}}\text{.}
\end{equation*}
In other words, if we were to increase the length of the rental by \(4\) days, the cost of the rental increases by \(8\) dollars. The slope gives the rate of increase in the rental fee, \($2\) per day.
In general, we say the slope of a line or equation measures the rate of change of the output variable with respect to the input variable. Depending on the units involved, this rate might be interpreted as a rate of growth or a rate of speed. A negative slope may represent a rate of decrease or a rate of consumption. The slope, or rate of change, of a graph can give us valuable information about the variables.
Example84
Nathan went hiking and took some trail mix. After hiking \(2.5\) miles he had eaten \(3\) ounces of trail mix. On average, how many ounces of trail mix did Nathan eat per mile?
SolutionThe amount of trail mix that Nathan has eaten depends on how far he has hiked. This tells us that the independent variable is the distance he has hiked, in miles, and the dependent variable is the ounces of trail mix. We are looking for the average rate of change of ounces of trail mix per mile.
\begin{equation*}
\frac{\text{change in ounces of trail mix}}{\text{change in miles climbed}}=\frac{3\text{ ounces}}{2.5\text{ miles}}=1.2 \text{ ounces per mile}
\end{equation*}
This tells us that Nathan ate \(1.2\) ounces of trail mix per mile on his hike.
