
In this section, you will...
define relations
represent relations with ordered pairs, tables, arrow diagrams, and graphs
identify the domain and range of a relation from its different representations
Mathematics is often concerned with how different mathematical objects are related to one another. For example, consider the equation \(y=x+1\text{.}\) Since \(x=3\text{,}\) \(y=4\) is a solution to this equation, one might say that \(x=3\) is related to \(y=4\text{.}\) In this section, we will define a mathematical relation and explore different ways that relations can be represented.
define relations
represent relations with ordered pairs, tables, arrow diagrams, and graphs
identify the domain and range of a relation from its different representations
The main topics of this section are also presented in the following videos:
A relation is a collection of pairs of objects from two sets. Often, the objects are numbers that have been paired together in a particular way. In the context of algebra, the relations of interest are sets of ordered pairs \((x,y)\) that are related by an algebraic equation. We call the first entry in the ordered pair the \(x\)-coordinate, and the second entry the \(y\)-coordinate.
For example, using the rule \(y=x+1\text{,}\) \(x=3\) is related to \(y=4\text{.}\) We would simply write that \((3,4)\) is a part of this relation. Some other ordered pairs in this relation are \((5,6)\text{,}\) \((-4,-3)\text{,}\) and \((1.52,2.52)\text{.}\)
In the example above, the pair \((4,3)\) is NOT in this relation. Ordered pairs look like \((x,y)\) with the \(x\)-coordinate appearing first.
If we wanted to list several ordered pairs of a relation, we could simply list them. The following is an example of a relation:
The brackets "\(\{ \ \}\)" are used to indicate a list of mathematical objects. In this course, you will see brackets used to indicate a set of ordered pairs for a relation, as well as sets of numbers.
Two ways that we can represent a relation that are more organized than a list of ordered pairs are with tables and arrow diagrams. The table and arrow diagram for this relation are shown below.
| \(x\) | \(y\) |
| \(4\) | \(6\) |
| \(2\) | \(1\) |
| \(0\) | \(4\) |
| \(5\) | \(5\) |
| \(-1\) | \(4\) |
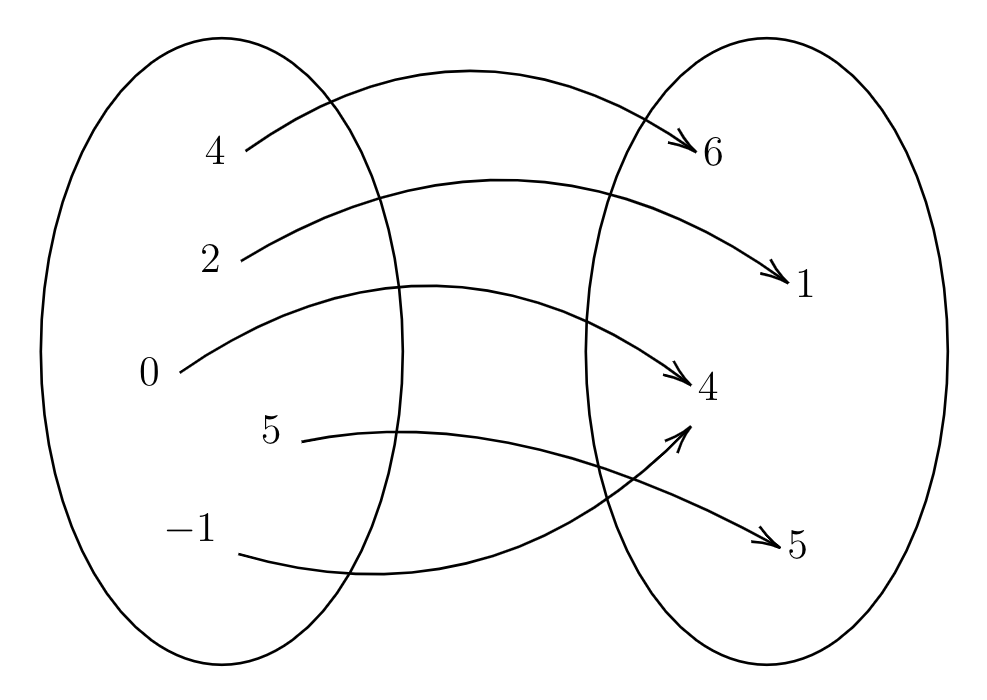
Arrow diagrams are less common than the other representations in this section, but are particularly useful when talking about functions, which will be discussed in Chapter 4.
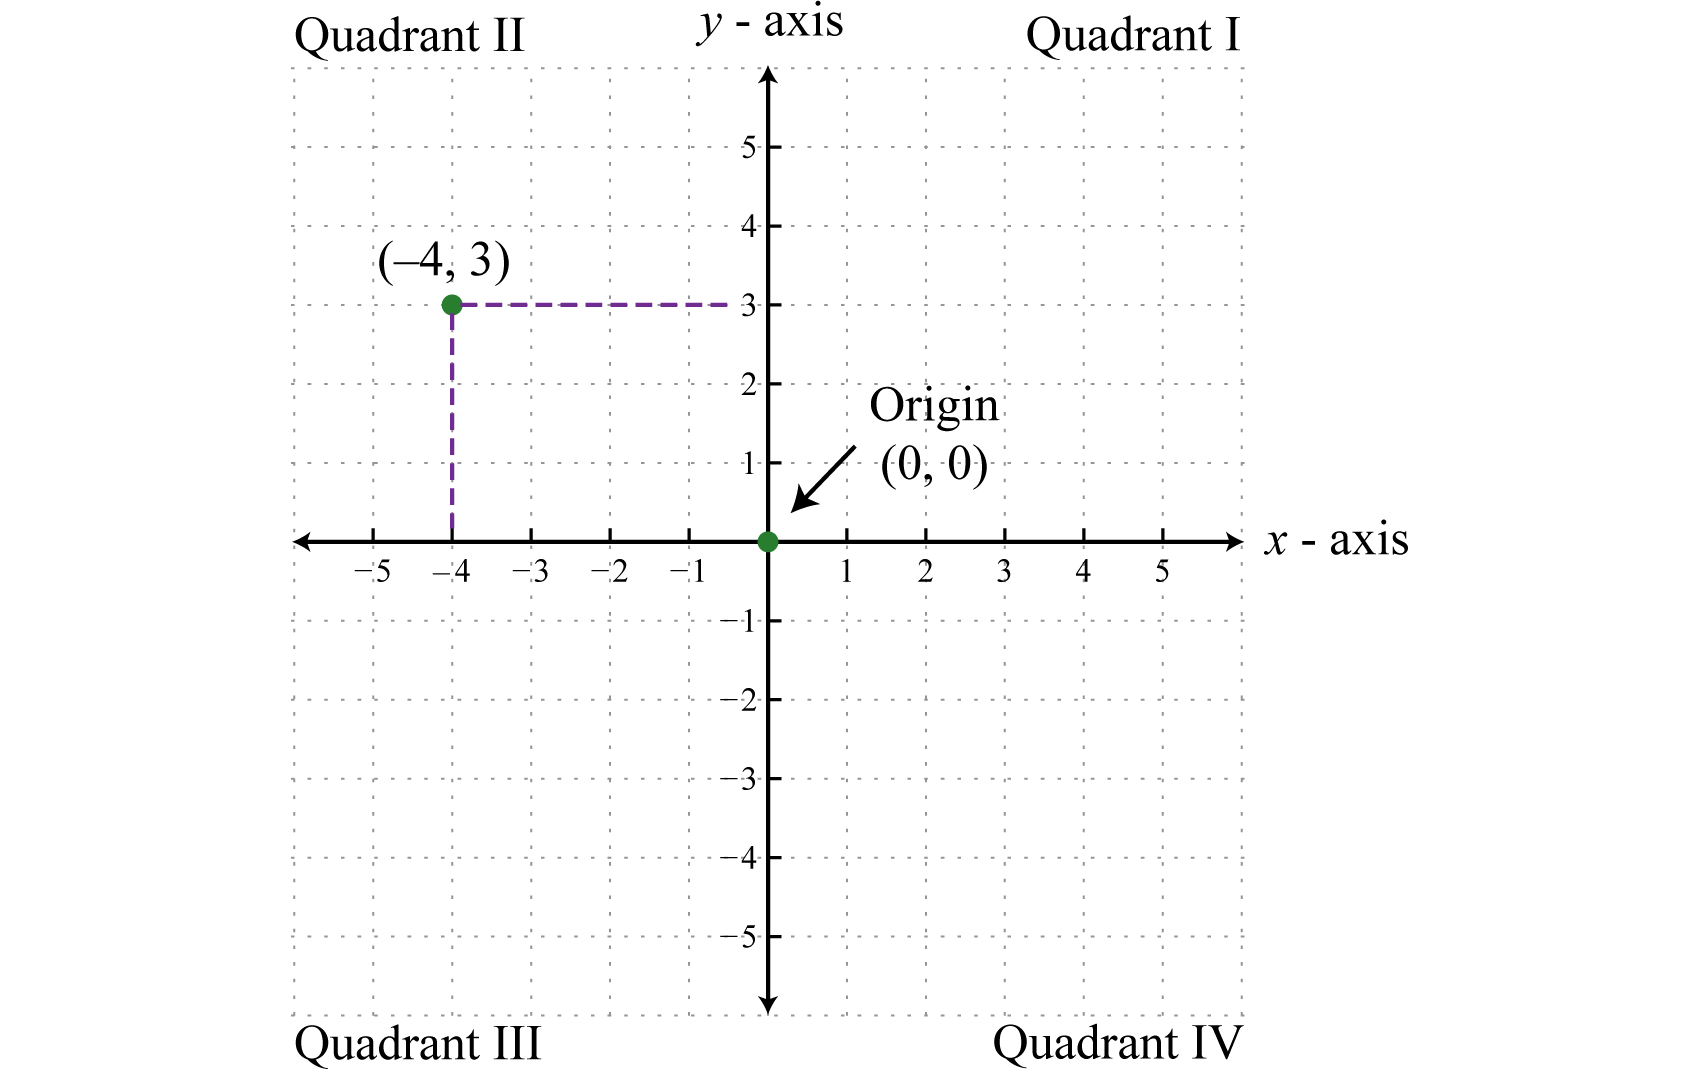
The last (and perhaps most important) representation of a relation that we will discuss is a graph. For relations between sets of numbers, graphs are a visual way to represent the relationship between the numbers on a coordinate plane. The rectangular coordinate system consists of two real number lines that intersect at a right angle. The horizontal number line is often referred to as the \(x\)-axis, and the vertical number line is often referred to as the \(y\)-axis. These two number lines define a flat surface called a plane. The intersection of the two axes is known as the origin, which corresponds to the point \((0, 0)\text{.}\)
The \(x\)- and \(y\)-axes break the plane into four regions called quadrants, named using Roman numerals I, II, III, and IV, as pictured. The ordered pair \((x, y)\) represents the position of points relative to the origin. For example, the ordered pair \((-4, 3)\) represents the position \(4\) units to the left of the origin, and \(3\) units above in the second quadrant.
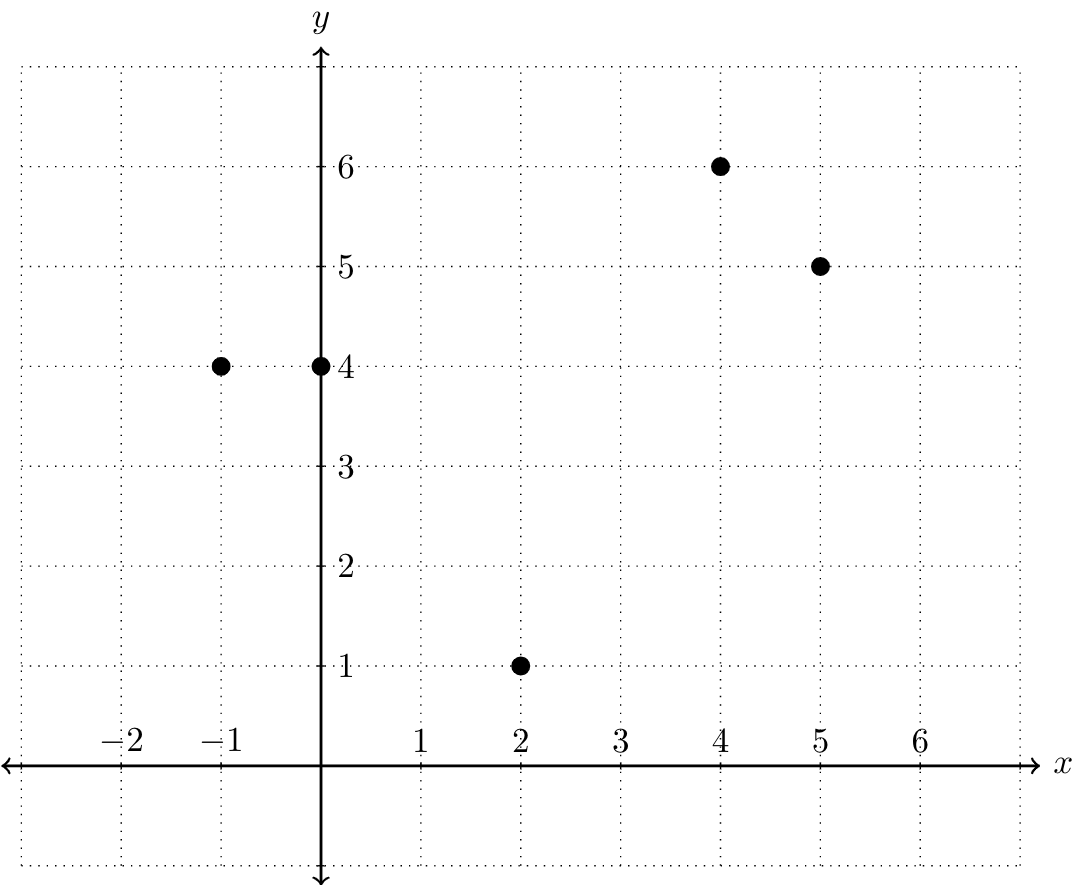
Returning to our previous example, the relation would be represented by the following graph:
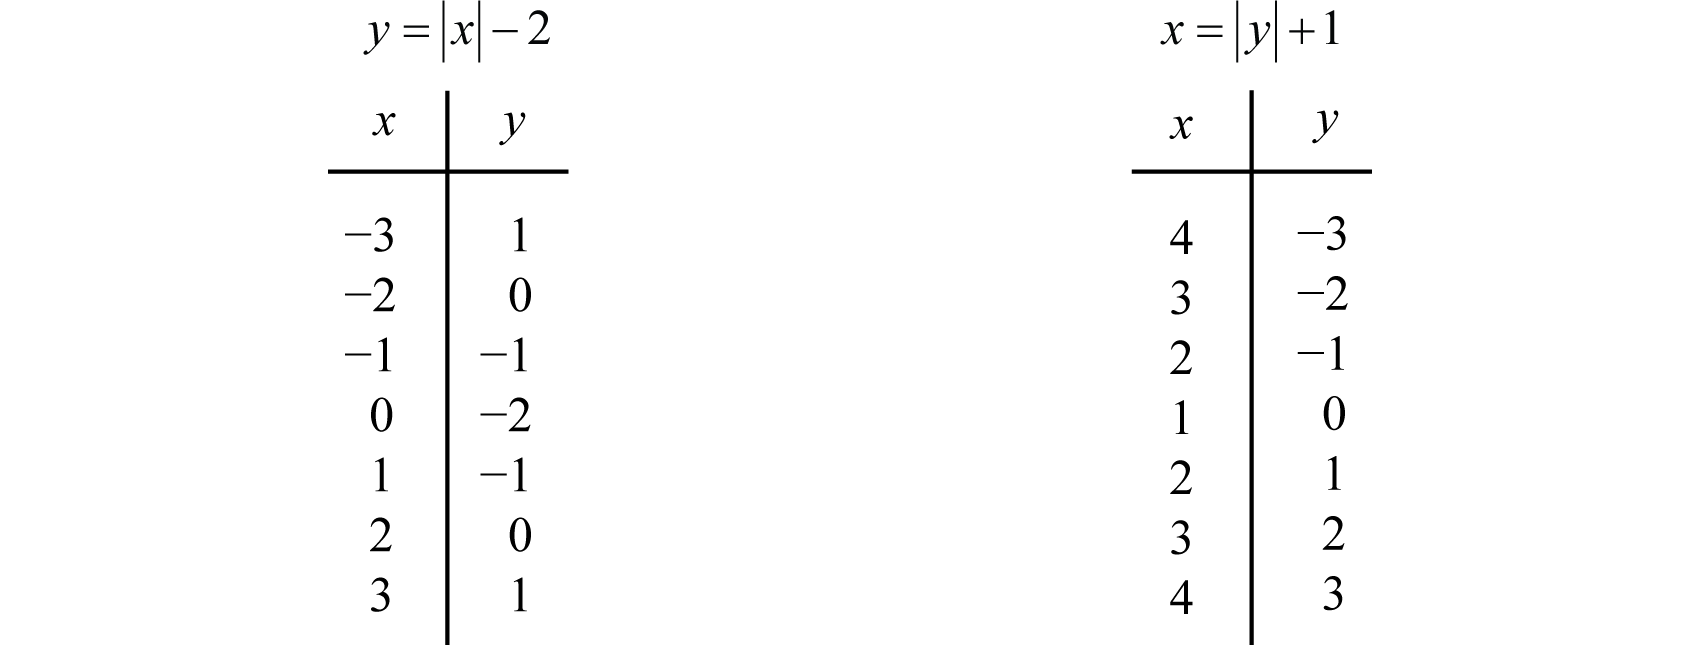
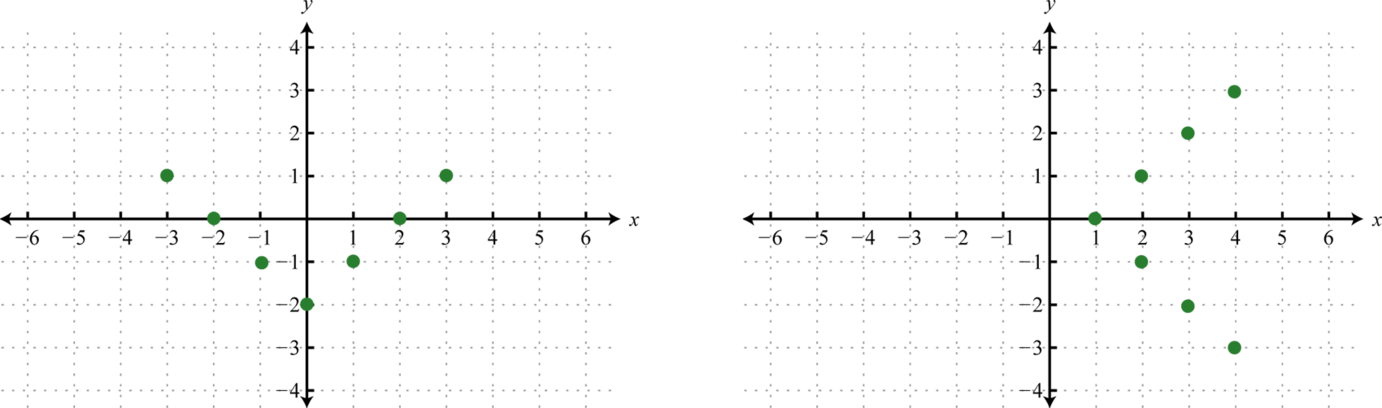
Let's explore another relation: consider the absolute value, denoted \(|x|\text{.}\) The absolute value takes an input \(x\) and tells us its distance from zero. For instance, \(|5|=5\text{,}\) \(|-7|=7\text{,}\) and \(|-112|=112\text{.}\) Now let's consider the algebraic equations \(y=|x|-2\) and \(x=|y|+1\text{.}\) Both these equations define relations between \(x\) and \(y\) involving the absolute values. The tables below show some of the ordered pairs for each of these relations.
As ordered pairs, we can list these solutions as well.
We can visually display any relation of this type on a coordinate plane by plotting the points, or ordered pairs.
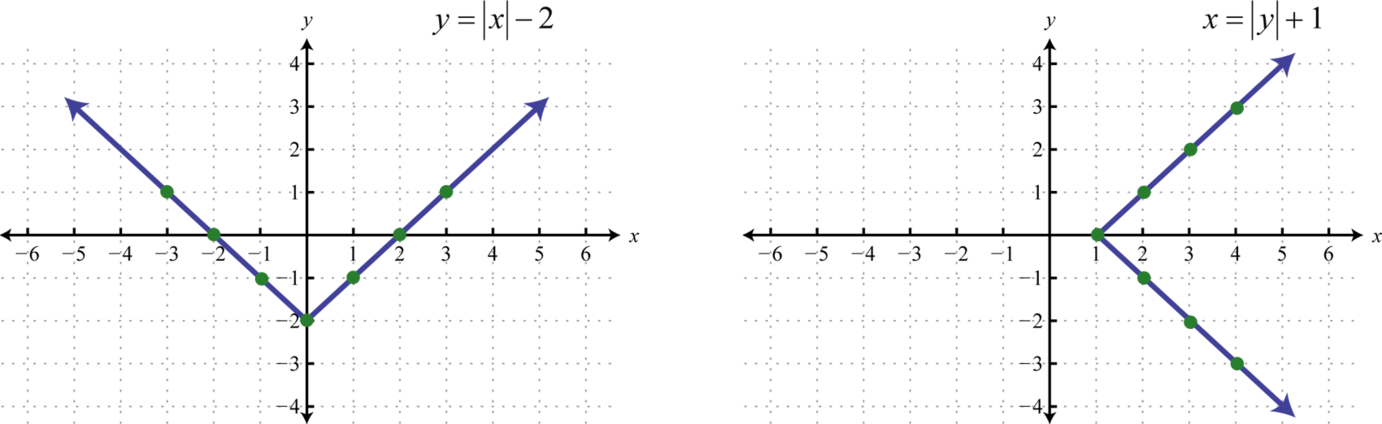
The solution sets of each equation will form a relation consisting of infinitely many ordered pairs. We can use the given ordered pair solutions to estimate all of the other ordered pairs by drawing a line through the given points. Here we put an arrow on the ends of our lines to indicate that this set of ordered pairs continues without bounds.
The set consisting of all of the first components of a relation, in this case the \(x\)-values, is called the domain. And the set consisting of all second components of a relation, in this case the \(y\)-values, is called the range (or codomain). Often, we can determine the domain and range of a relation if we are given its graph.
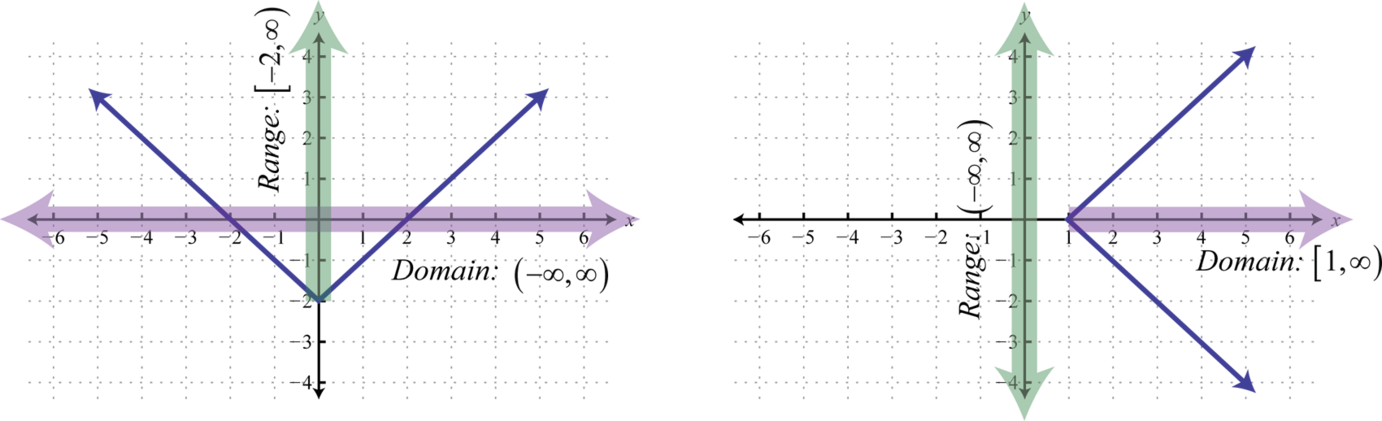
Here we can see that the graph of \(y=|x|-2\) has a domain consisting of all real numbers, \(\mathbb{R}=(-\infty,\infty)\text{,}\) and a range of all \(y\)-values greater than or equal to \(-2\text{,}\) \([-2,\infty)\text{.}\) The domain of the graph of \(x=|y|+1\) consists of all \(x\)-values greater than or equal to \(1\text{,}\) \([1,\infty)\text{,}\) and the range consists of all real numbers, \(\mathbb{R}=(-\infty,\infty)\text{.}\)
Determine the domain and range of the following relation. 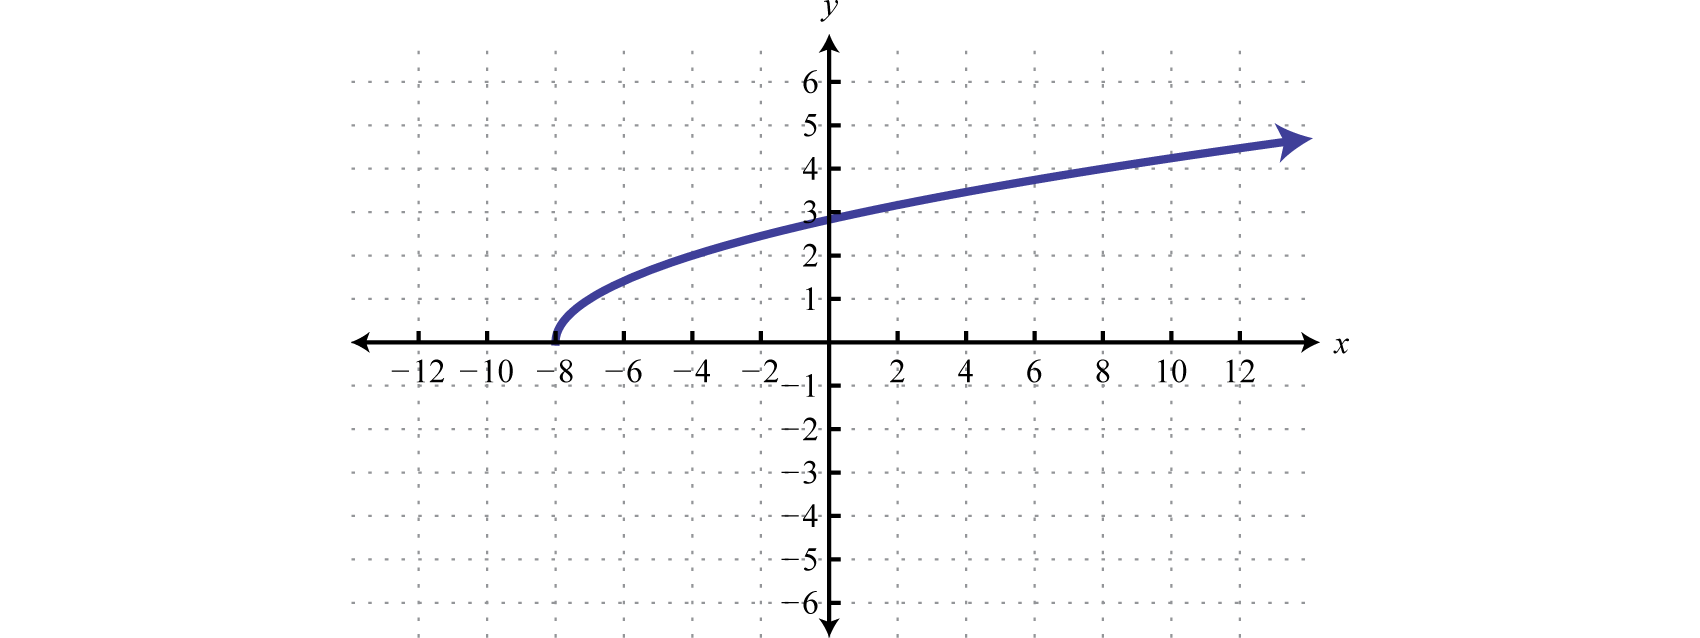
The minimum \(x\)-value represented on the graph is \(-8\) and all others are larger. Therefore the domain consists of all \(x\)-values in the interval \([-8,\infty)\text{.}\) The minimum \(y\)-value represented on the graph is \(0\) so the range is \([0,\infty)\text{.}\) 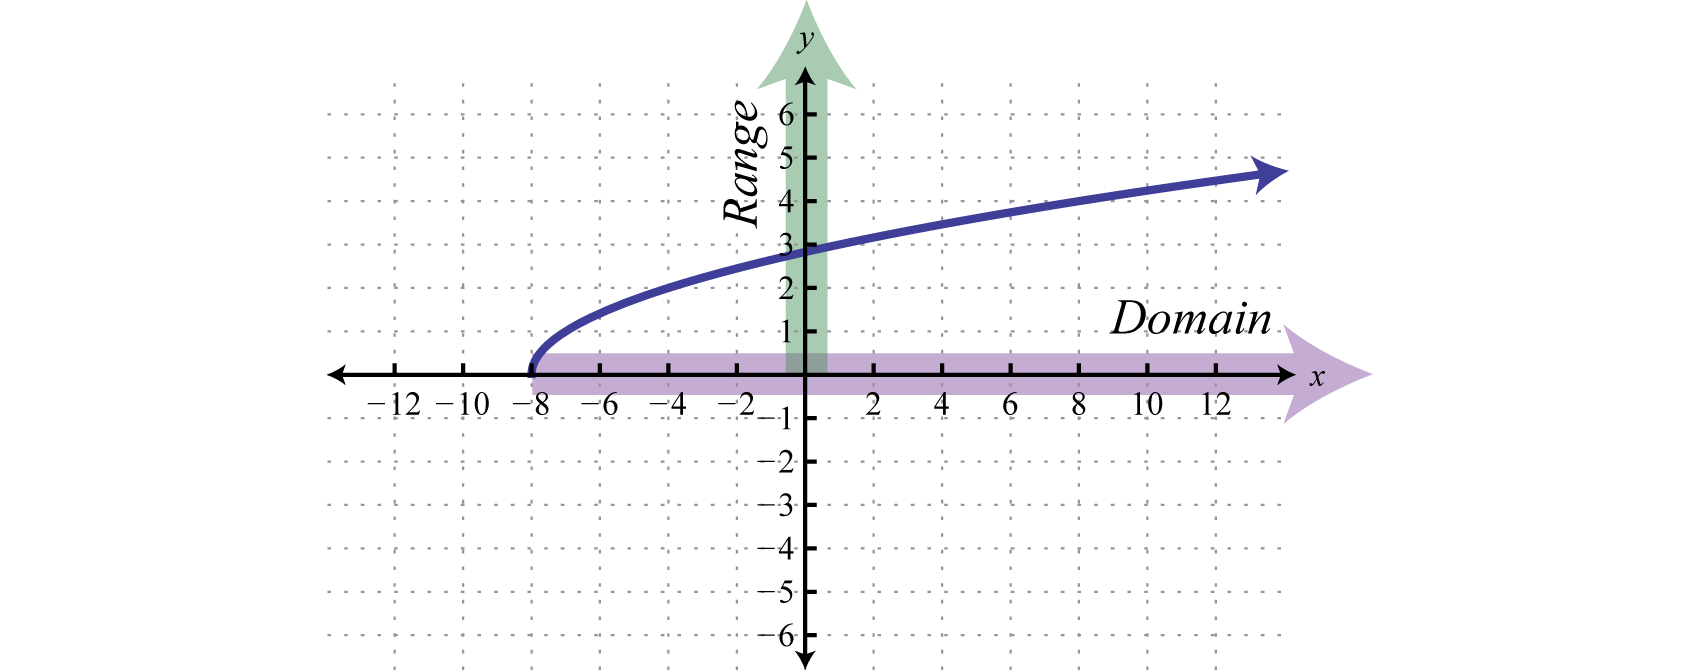 The domain is given by \([-8,\infty)\) and the range is \([0,\infty)\text{.}\)
Determine the domain and range of the following relation.
The domain is the set of first components of a relation; for this relation, the first components are
The range is the set of the second components, which are
Notice that \(6\) was a second component twice. This is allowed, but we only need to list it in the range once.
The domain and range of a relation do not indicate which components are related to one another, so the order that we list elements of the domain and range does not matter.