
Supplemental Videos
The main topics of this section are also presented in the following videos:
The main topics of this section are also presented in the following videos:
A function may be defined by different formulas on different portions of the \(x\)-axis. Such a function is said to be defined piecewise. To graph a function defined piecewise, we consider each piece of the \(x\)-axis separately.
Graph the function defined by
Think of the plane as divided into two regions by the vertical line \(x = 1\text{,}\) as shown in Figure150. In the left-hand region (\(x \le 1\)), we graph the line \(y = x + 1\text{.}\) (The fastest way to graph the line is to plot its intercepts, \((-1, 0)\) and \((0, 1)\text{.}\))
Notice that the value \(x = 1\) is included in the first region, so \(f (1) = 1 + 1 = 2\text{,}\) and the point \((1, 2)\) is included on the graph. We indicate this with a solid dot at the point \((1, 2)\text{.}\)
In the right-hand region (\(x \gt 1\)), we graph the horizontal line \(y = 3\text{.}\) The value \(x = 1\) is not included in the second region, so the point \((1, 3)\) is not part of the graph. We indicate this with an open circle at the point \((1, 3)\text{.}\)

Graph the piecewise defined function
The absolute value function \(f (x) = \abs{x}\) is an example of a function that is defined piecewise.
To sketch the absolute value function, we graph the line \(y = x\) in the first quadrant and the line \(y = -x\) in the second quadrant.
Write a piecewise definition for \(g(x) = \abs{x - 3}\text{.}\)
Sketch a graph of \(g(x) = \abs{x - 3}\text{.}\)
In the definition for \(\abs{x}\text{,}\) we replace \(x\) by \(x - 3\) to get
We can simplify this expression to
In the first region, \(x \ge 3\text{,}\) we graph the line \(y = x - 3\text{.}\) Because \(x = 3\) is included in this region, the endpoint of this portion of the graph, \((3, 0)\text{,}\) is included, too.
In the second region, \(x \lt 3\text{,}\) we graph the line \(y = -x + 3\text{.}\) Note that the two pieces of the graph meet at the point \((0, 3)\text{,}\) as shown in Figure153.

To identify the domain and range of a piecewise function, we recall that a piecewise function is defined by different functions each with corresponding domains.
Then the domain of the piecewise function is the combination of these domains, and the range of the piecewise function is the combination of the ranges of the functions on their corresponding domains. This idea is better illustrated in the following example.
Find the domain and range of the function
By definition, we see that \(f\) is comprised of two functions:
\(x^2-6\) on the domain \([0,4]\)
\(-x+10\) on the domain \([5,10)\)
Then the domain of \(f \) is the combination of the domains of the two functions listed above. We represent this as
The symbol "\(\cup\)" is shorthand for the word "and".
Each of the functions which make up \(f\) were considered in the Domain and Range Section as examples. Putting together the two graphs, we get the graph of \(f \text{:}\) 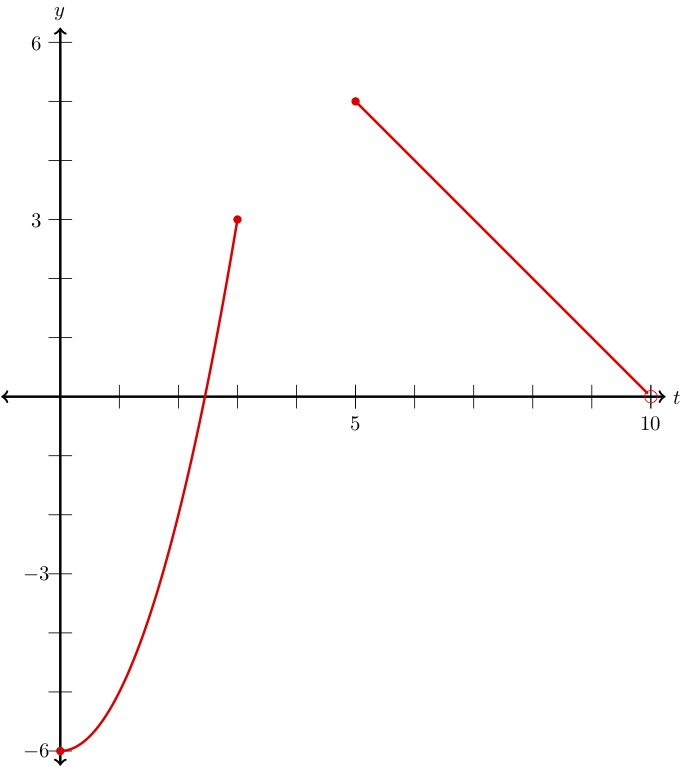
In the Domain and Range Section we found that the range of \(x^2-6\) on the domain \(0\le x\le 4\) is \([-6,10]\text{.}\) Additionally, we found that the range of \(-x+10\) on the domain \(5\le x\lt 10\) is \((0,5]\text{.}\) Then the range of \(f \) is the combination of these two ranges:
However, notice that we can simplify this a bit. Since the values in the interval \((0,5]\) are contained in the interval \([-6,10]\) and thus
