
Supplemental Videos
The main topics of this section are also presented in the following videos:
The main topics of this section are also presented in the following videos:
In this section, we explore how transformations of trigonometric functions affect properties of trigonometric functions such as midline, amplitude, and period.
Recall from Section that if we apply function transformations to the sine function, then the resulting function is of the form \(f(x) = A\sin(B(x-h))+k \text{.}\) Similarly, if we apply function transformations to the cosine function, then the resulting function is of the form \(g(x) = A\cos(B(x-h))+k \text{.}\) We call a function of either of these two forms a generalized sinusoidal function.
Given an equation in the form
\(|A| \ \) is the vertical stretch/compression and the amplitude of the function.
\(B \ \) is the horizontal stretch/compression and is related to the period of the function, \(P\text{,}\) by the formula
\(k \ \) is the vertical shift and determines the midline of the function.
\(h \ \) is the horizontal shift of the function.
Determine the midline, amplitude, and period of the function
Using the relationships above, the stretch/compression factor is \(B=\pi/4=\pi/4\text{.}\) Therefore, the period of the function is
The vertical stretch/compression factor is \(|A|=|2|=2\text{,}\) so the amplitude of the function is 2.
Finally, the vertical shift of the function is \(k=1\text{,}\) so the midline of the function is
We can use the properties of generalized sinusoidal functions to help us graph them, as seen in the examples below.
Sketch a graph of the function
To begin, let's find the period, midline, and amplitude of the function.
Using the relationships above, the stretch/compression factor is \(B=2\text{.}\) Therefore, the period is
The vertical stretch/compression factor is \(|A|=|3|=3\text{,}\) so the amplitude is 3.
Finally, the vertical shift of the function is \(k=4\text{,}\) so the midline of the function is
To graph \(g(x)\text{,}\) it will also be helpful to know the function's starting behavior, which is its behavior at the \(y\)-axis. Using our knowledge of the graph of \(f(x)=\sin(x)\text{,}\) discussed in a previous section, we know that at the \(y\)-axis, the the sine "wave" is at its midline, and curves up as we move to the right on the graph. Since there is no horizontal shift or vertical reflection in \(g(x)\text{,}\) then this is also the behavior of \(g(x)\) at the \(y\)-axis.
It will also be helpful to identify the maximum and minimum of \(g(x)\text{.}\) Since the midline is \(y=4\) and the amplitude is \(3,\) then the maximum is 7 and the minimum is 1.
Since our midline is at \(y=4\) and this is where \(g(x)\) "starts", then at the \(y\)-axis, our function is at \(y=4\text{.}\) The wave curves up to our maximum of 7, then curves down to our minimum of 1, and finally returns back to the starting position at \(x=\pi\) since this is our period. This is graphed below.
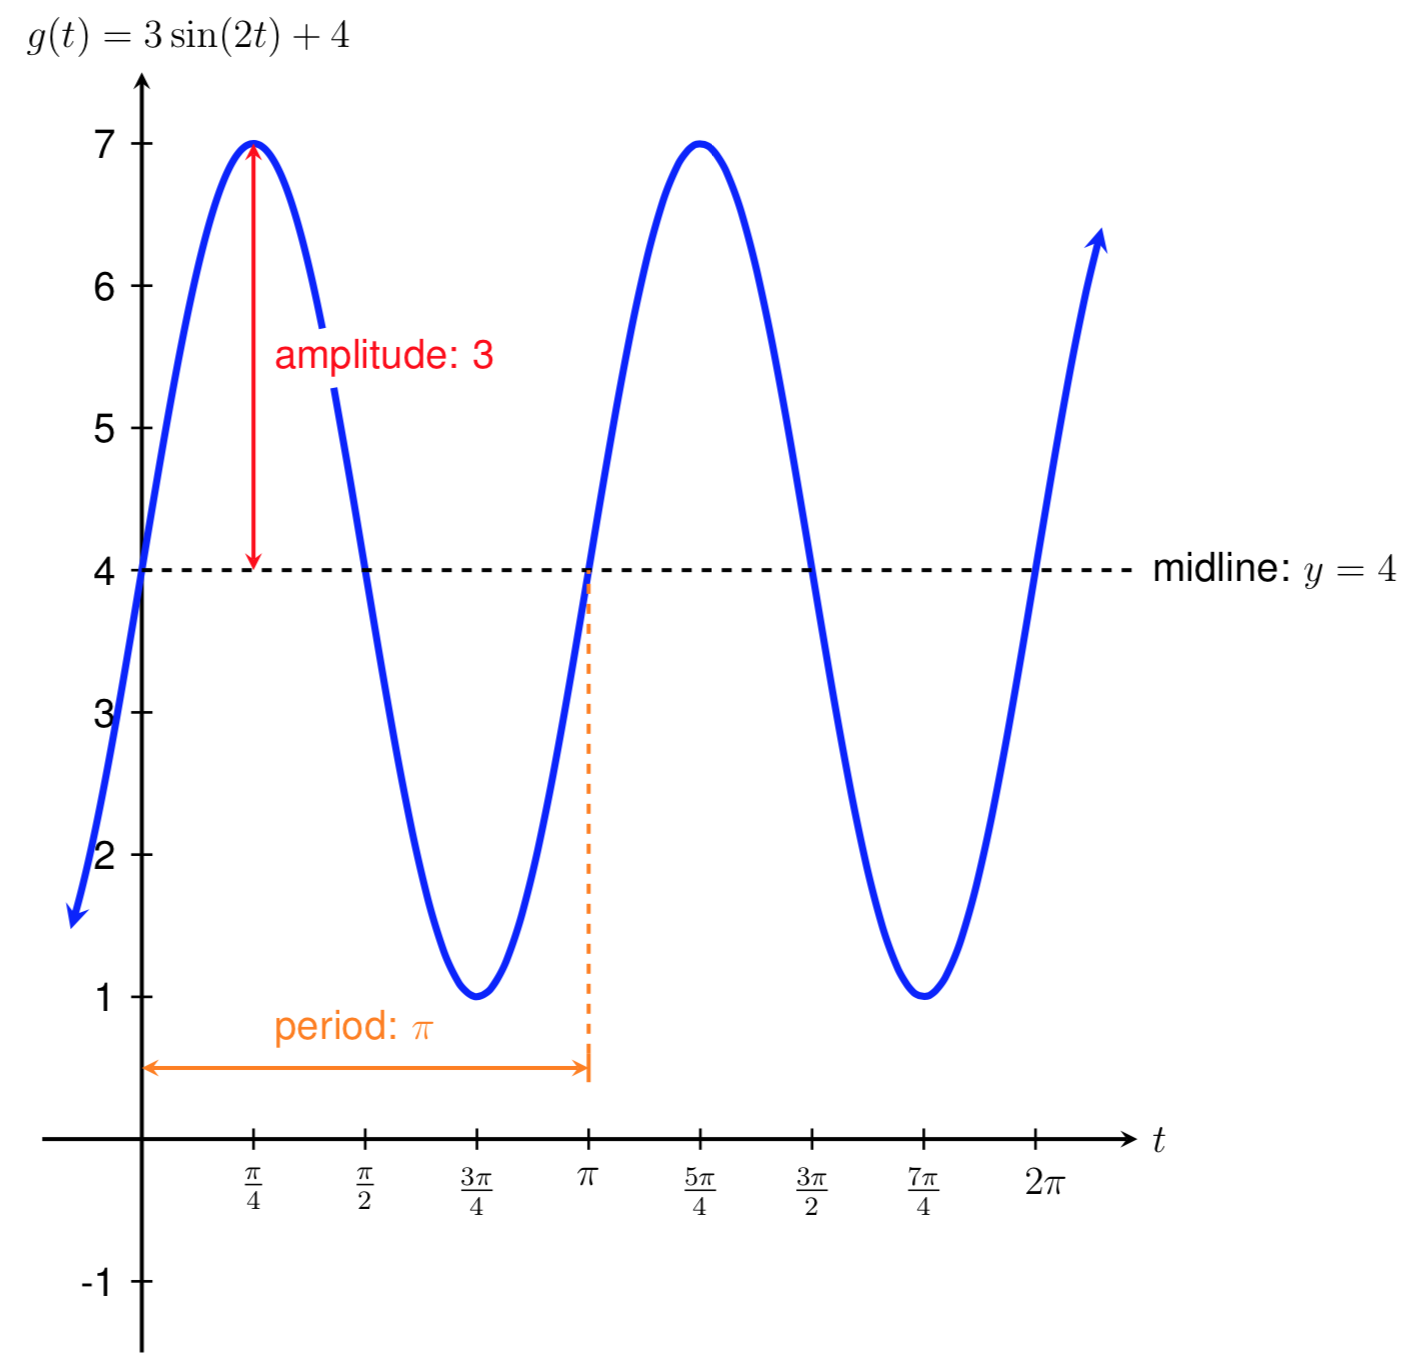
Note that the graph of \(g(x)=3\sin(x)+4\) involves a vertical stretch of 3, a vertical shift up by 4, and a horizontal compression by a factor of \(2\) from the original graph of \(f(x)=\sin(x)\text{,}\) which makes sense based on our discussion of function transformations in the previous section.
Sketch a graph of the function
To begin, let's find the period, midline, and amplitude of the function.
Using the relationships above, the stretch/compression factor is \(B=0.5\text{.}\) Therefore, the period is
The vertical stretch/compression factor is \(|A|=|-2|=2\text{,}\) so the amplitude is 2.
Finally, the vertical shift of the function is \(k=-1\text{,}\) so the midline of the function is
Again, to graph \(g(x)\text{,}\) it will also be helpful to know the function's starting behavior. Since there is no horizontal shift, we consider our starting behavior to be at the \(y\)-axis. Using our knowledge of the graph of \(f(x)=\cos(x)\text{,}\) discussed in a previous section, we know that at the \(y\)-axis, the the cosine "wave" is at its maximum and curves down as we move to the right. Since the cosine function is multiplied by \(-2\text{,}\) then there is a reflection across the \(y\)-axis of \(\cos(x)\text{.}\) So, at the \(y\)-axis, \(g(x)\) is at its minimum and curves up as we move to the right.
It will also be helpful to identify the maximum and minimum of \(g(x)\text{.}\) Since the midline is \(y=-1\) and the amplitude is 2, then the maximum is 1 and the minimum is -3.
Since our maximum is at \(y=1\) and this is where \(g(x)\) "starts", then at the \(y\)-axis, our function is at \(y=1\text{.}\) The wave curves down to our minimum of -3 and curves back up to our maximum of 1 at \(x=4\pi\text{.}\) This is graphed below.

Note that the graph of \(g(x)=-2\cos(.5x)-1\) involves vertical stretch of 2 and a reflection across the \(y\)-axis, a vertical shift down of 1, and a horizontal stretch by a factor of 2 from our original graph of \(y=\cos(x)\text{,}\) which makes sense based on our discussion of function transformations in the previous section.
Sketch a graph of the function
To begin, let's find the period, midline, and amplitude of the function.
Using the relationships above, the stretch/compression factor is \(B=\pi\text{.}\) Therefore, the period is
The vertical stretch/compression factor is \(|A|=|-.5|=.5\text{,}\) so the amplitude is .5.
Finally, the vertical shift of the function is \(k=2\text{,}\) so the midline of the function is
First we identify the starting behavior of \(g(x)\text{.}\) Here we must be careful because we have a horizontal shift to the right by 1 unit, so we consider our starting behavior at \(x=1\) instead of at the \(y\)-axis. We know that the graph of \(\sin(x)\) starts at the midline and curves up, and since we have a vertical reflection, this means that \(g(x)\) starts at the midline and curves down as we move to the right at \(x=1\text{.}\)
We also need to identify the maximum and minimum of \(g(x)\text{.}\) Since the midline is \(y=2\) and the amplitude is .5, then the maximum is 2.5 and the minimum is 1.5.
Because there is a horizontal shift to the right by 1 unit, then the graph of \(g(x)\) is at the midline at \(x=1\text{,}\) decreases to the minimum of 1.5, and then increases until it reaches its maximum of 2.5, and returns to the midline at \(x=3\text{,}\) after one period has passed. This is graphed below.

Note that the graph of \(g(x)=-.5\sin(\pi(x-1))+2\) involves vertical compression by a factor of 2, a reflection across the \(y\)-axis, a vertical shift up by 2 units, and a horizontal compression by a factor of \(\pi\) from our original graph of \(y=\cos(x)\text{,}\) which makes sense based on our discussion of function transformations in the previous section.
We can also use the relationship between transformations and the properties of trigonometric functions to write equations for generalized sinusoidal functions.
Find a formula for the sinusoidal function graphed below.
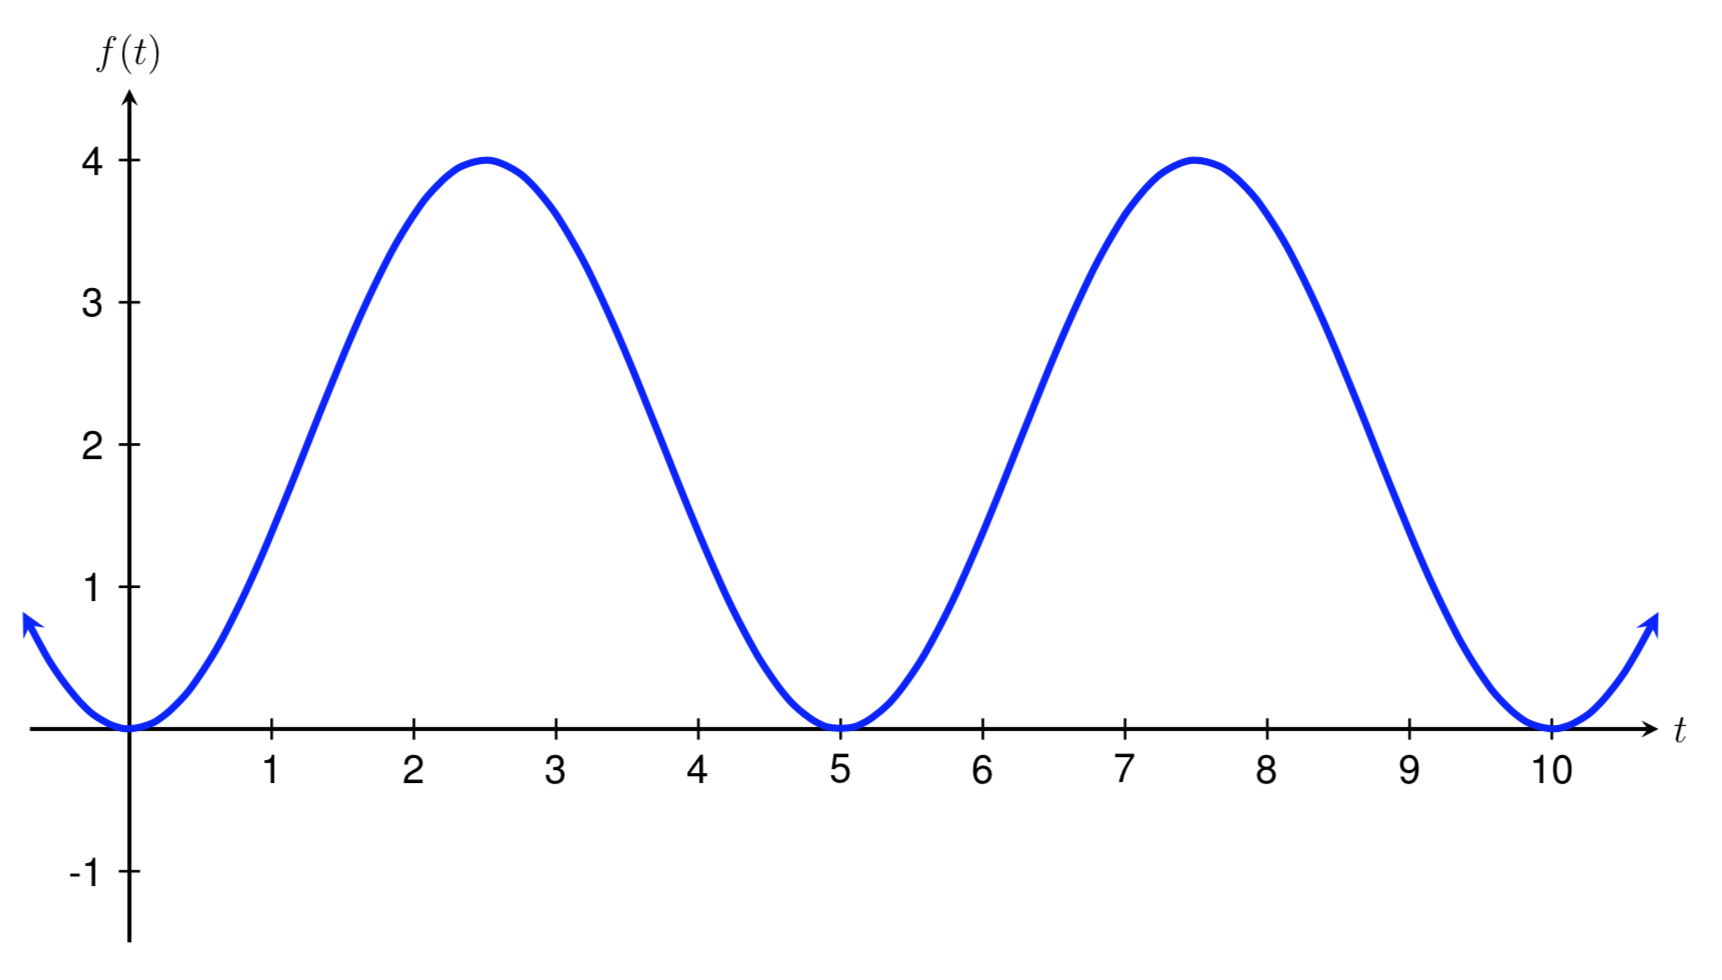
To begin, let's find the period, midline, and amplitude of the function graphed above.
Recall that the period of the function is how long it takes for the function to start repeating. If we think about the function "starting" at \(x=0\text{,}\) or when it crosses the \(y\)-axis, we can see that the function above begins repeating when \(x=5\text{.}\) Therefore, the period of the function graphed above is 5.
Since the period of a function is related to \(B\text{,}\) the stretch/compression factor, we can use the relationship \(P = 2\pi/B\) to solve for \(B\text{.}\) Substituting 5 in for \(P\text{,}\) we get
For now, we can assume that the \(B\) value is positive, which gives us
The midline of the function is the horizontal line halfway between the function's maximum and minimum values. Here, the maximum value of the function is 4 and the minimum value is 0. The number halfway between 4 and 0 is 2, so the midline is the line \(y=2\text{.}\) Therefore, the vertical shift of the function graphed above is
Finally, the amplitude of the function is the distance between the function's maximum value and the midline. The distance between the function's maximum value of 4 and the function's midline of \(y=2\) is 2, so the amplitude of the function above is 2. Therefore, the vertical stretch factor is
We now need to decide what type of sinusoidal function to use and whether \(A\) is positive or negative. Note that the function shown above crosses the \(y\)-axis at its minimum value. Since \(\cos(x)\) crosses the \(y\)-axis at its maximum value, then we need to use a vertical reflection of a cosine graph to model this function, which means that
Using our work above and substituting our known values into the generalized cosine function \(g(t)=A\cos(Bt) + k\) gives us the following formula for the function graphed above.
To check our solution, we can use a graphing calculator to graph the function we came up with and confirm that it matches the graph shown above.
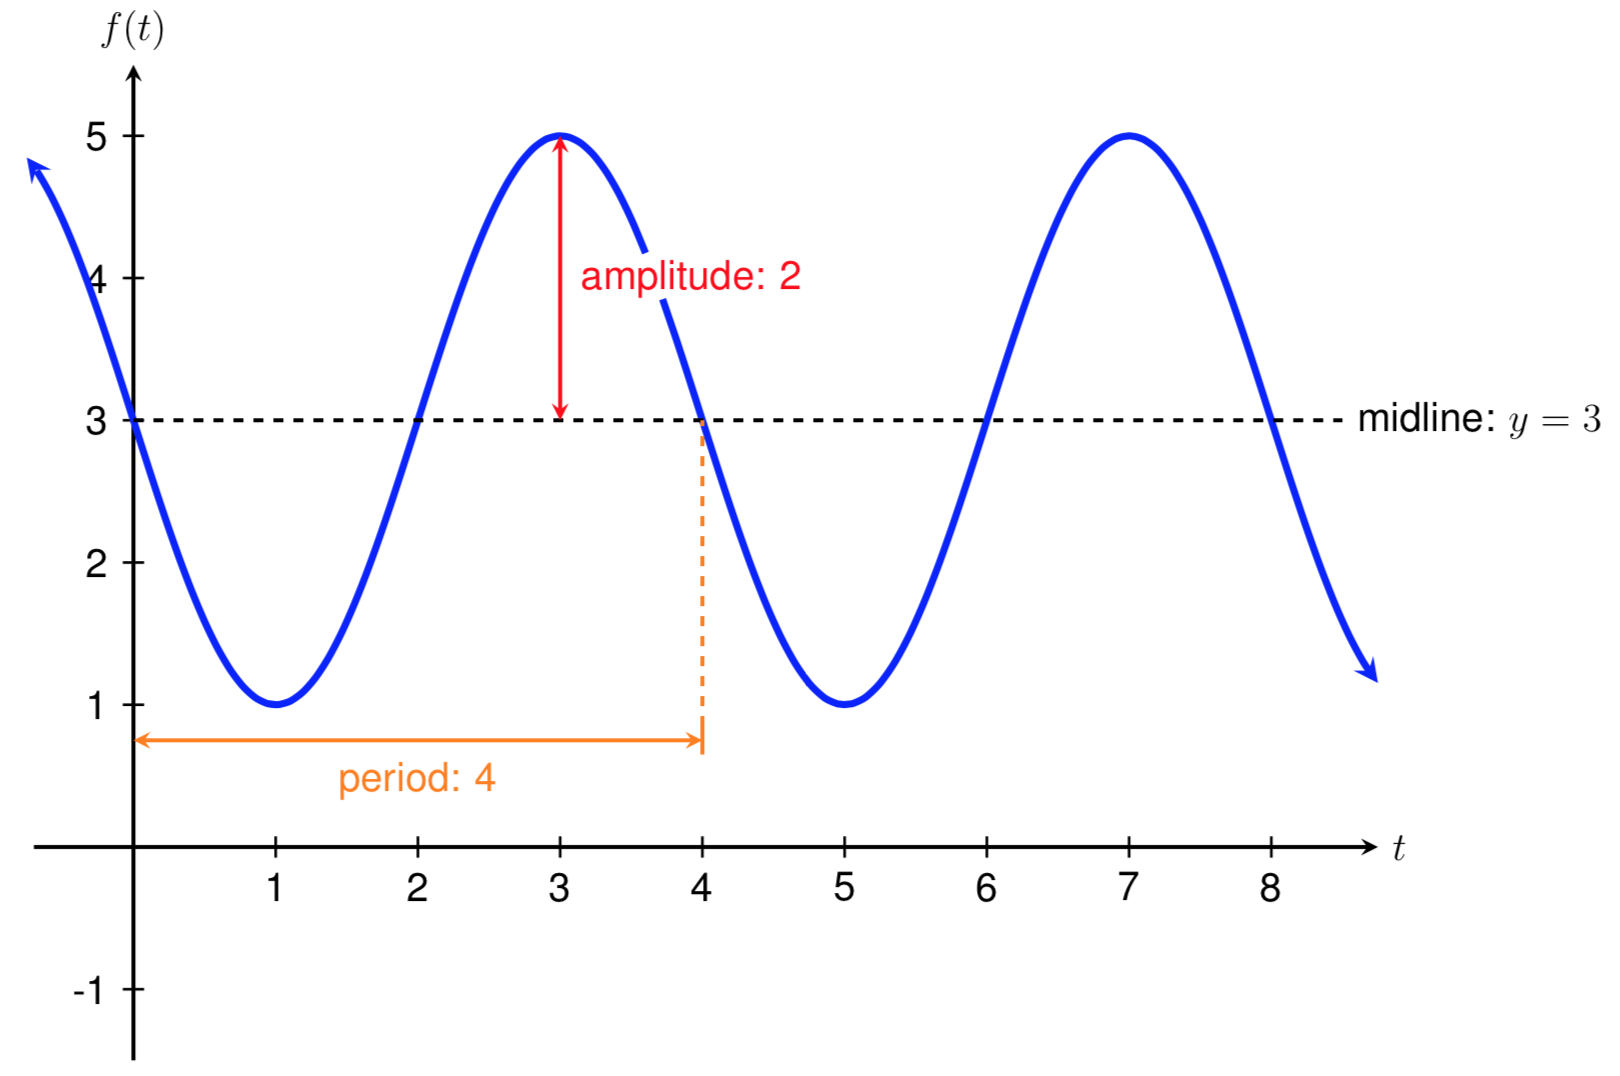
Find a possible formula for a sinusoidal function with an amplitude of 2, a period of 4, and that crosses the \(y\)-axis on the midline at the point \((0,3)\text{.}\) Assume that the function is decreasing when it crosses the midline.
To begin, let's sketch a graph of the function based on the known information. We know that the graph crosses the \(y\)-axis on the midline at the point \((0,3)\) and that the function is decreasing at that point. We also know that the amplitude of the function is 2 and the period is 4. Below is a graph of the function that fits this description.
Since we know the period is 4, we can use the relationship \(P = 2\pi/B\) to solve for B. Substituting 4 in for \(P\text{,}\) we get
Next, we know that the function crosses the \(y\)-axis at the point \((0,3)\text{,}\) which is on the midline of the function. Therefore, the midline of the function is \(y=3\) so
Finally, the amplitude of the function is 2, so
We now need to decide what type of sinusoidal function to use and whether \(A\) is positive or negative. Note that the function above crosses the \(y\)-axis at its midline. Therefore, we can use a sine graph to model this function. Since the function is decreasing as it crosses the \(y\)-axis, we also need to use a vertical reflection, which means that
Using our work above and substituting our known values into the generalized sine function \(f(t)=A\sin(Bt) + k\) gives us the following formula for the function described and graphed above.
To check our solution, we can use a graphing calculator to graph the function we came up with and confirm that it matches the graph shown above.
Sketch a graph of \(\displaystyle f(t)=4\sin\left(\frac{\pi}{3}t-\frac{\pi}{3}\right)\text{.}\)
To reveal the horizontal shift, we first need to factor what is inside the sine function. Factoring out a \(\pi/3\) from both terms gives us
Now that the function is in the form \(f(t)=A\sin(B(t-h))+k\text{,}\) we can determine the period, midline, amplitude, and horizontal shift of the function in order to help us graph it.
The stretch/compression factor is \(B=\pi/3\) so the period is
The vertical stretch/compression factor is \(|A|=|4|=4\text{,}\) so the amplitude of the function is 4.
The vertical shift of the function is \(k=0\text{,}\) so the midline of the function is \(y=0\text{,}\) which is the \(x\)-axis. Therefore, there is no vertical shift of this function.
Finally, the horizontal shift of the function is \(h=1\text{.}\) Since \(h\) is positive, the graph will be shifted to the right by 1.
Using our knowledge of the graph of \(f(t)=\sin(t)\text{,}\) we can sketch a transformed graph of
Note that the midline of the two functions is the same, but their amplitude and period are different. In addition, the transformed function is shifted horizontally from the original function. Therefore, the transformed graph involves a vertical stretch of 4, a horizontal compression by a factor of \(3/\pi\text{,}\) and a horizontal shift right by 1 from the original graph of \(f(t)=\sin(t)\text{,}\) which we discussed in a previous section. Shown below is the graph of the transformed function