In this section, you will...
define functions and explore different representations of functions
determine whether a relation is a function from various representations
determine the domain and range of functions
In Chapter2, we defined a relation to be a collection of pairs of objects from two sets. In this section, we will talk about an important type of relation called a function.
define functions and explore different representations of functions
determine whether a relation is a function from various representations
determine the domain and range of functions
The main topics of this section are also presented in the following videos:
A function is a relation in which each input is related to exactly one output. Here, "input" and "output" refer to the first coordinate and the second coordinate, respectively.
For example, consider the following relation:
In this relation, the input of \(-1\) is related to an output of \(4\text{,}\) the input of \(0\) is related to an output of \(7\text{,}\) etc. Since each input is related to exactly one output, this relation is a function.
Determine whether the following relation is a function.
Although most of the inputs correspond to exactly one output, the input of \(3\) has two outputs: \(5\) and \(7\text{.}\) Since there is an input with more than one output, this relation is not a function.
In Chapter2, we defined the domain of a relation to be the set of first components. A more standard way to define domain is that it is the set of all of the inputs. Similarly, the range of a relation is the set of all of its outputs.
Determine whether the following relation is a function. State the domain and range of the relation.
Since each input corresponds to exactly one output, this relation is a function. The domain is the set of all \(x\)-coordinates and the range is the set of all \(y\)-coordinates.
Note that \(2\) being the output for two different inputs does not violate the definition of a function.
All of the representations of relations can be used to represent functions as well. Each representation has unique characteristics that can be used to determine whether the relation is a function and to identify the domain and range.
Determine whether the relation given by the table below is a function. State the domain and range.
| \(x\) | \(y\) |
| \(4\) | \(6\) |
| \(2\) | \(1\) |
| \(0\) | \(4\) |
| \(5\) | \(5\) |
| \(-1\) | \(4\) |
The inputs are the entries in the left column. Each input corresponds to exactly one output, so this is a function. The domain is all of the numbers in the left column, and the range is all the numbers in the right column.
Determine whether the relation given by the table below is a function. State the domain and range.
| \(x\) | \(y\) |
| \(3\) | \(7\) |
| \(5\) | \(10\) |
| \(0\) | \(-4\) |
| \(5\) | \(5\) |
| \(-2\) | \(-4\) |
The input \(5\) appears in the table twice, and it has two different outputs. Since the input of \(5\) has more than one output, this is not a function.
The next two examples involve arrow diagrams. Pay special attention to the difference between the arrow diagram that represents the function and the arrow diagram that represents a non-function.
Determine whether the relation given by the arrow diagram below is a function. State the domain and range.
![]()
In an arrow diagram, the arrows are drawn from an input to its correspond output. All of the inputs (the numbers in the left bubble) have an arrow taking them to exactly on number. Since each input corresponds to exactly one output, this relation is a function.
Determine whether the relation given by the arrow diagram below is a function. State the domain and range.
![]()
In this relation, there are two arrows pointing out of \(-3\text{.}\) This means that the input \(-3\) has two outputs, namely \(2\) and \(-4\text{.}\) Since there is an input with more than one output, this relation is not a function.
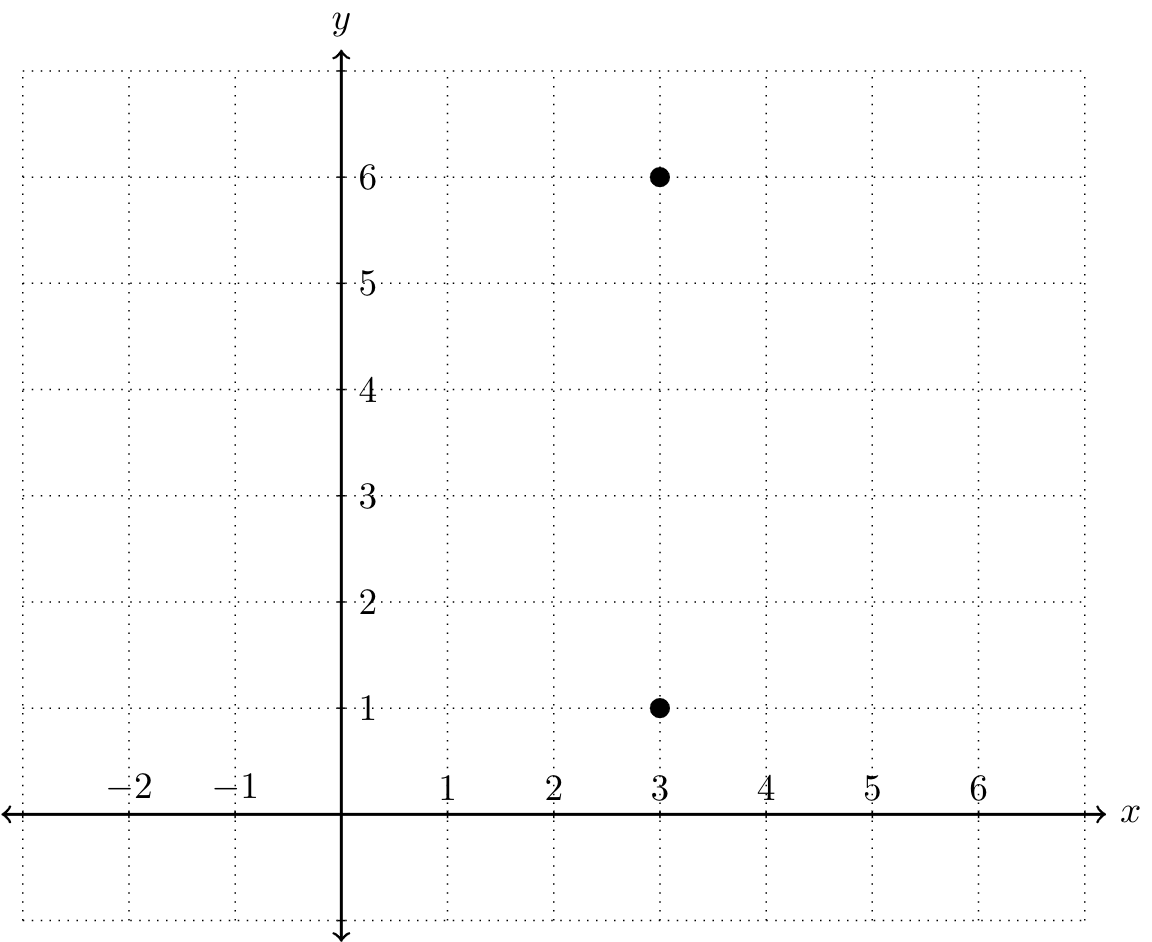
One of the most useful ways to represent a relation is with a graph. For each point on the graph, the input is the \(x\)-coordinate and the output is the \(y\)-coordinate. If one input has two different outputs, then there would be two distinct points with the same \(x\)-value. Since they have the same \(x\)-value, one would be directly above the other. For example, suppose we have a relation with the ordered pairs \((3,1)\) and \((3,6)\text{.}\) The input of \(3\) corresponds to two outputs, \(1\) and \(6\text{,}\) so this is not a function. Graphically, we have
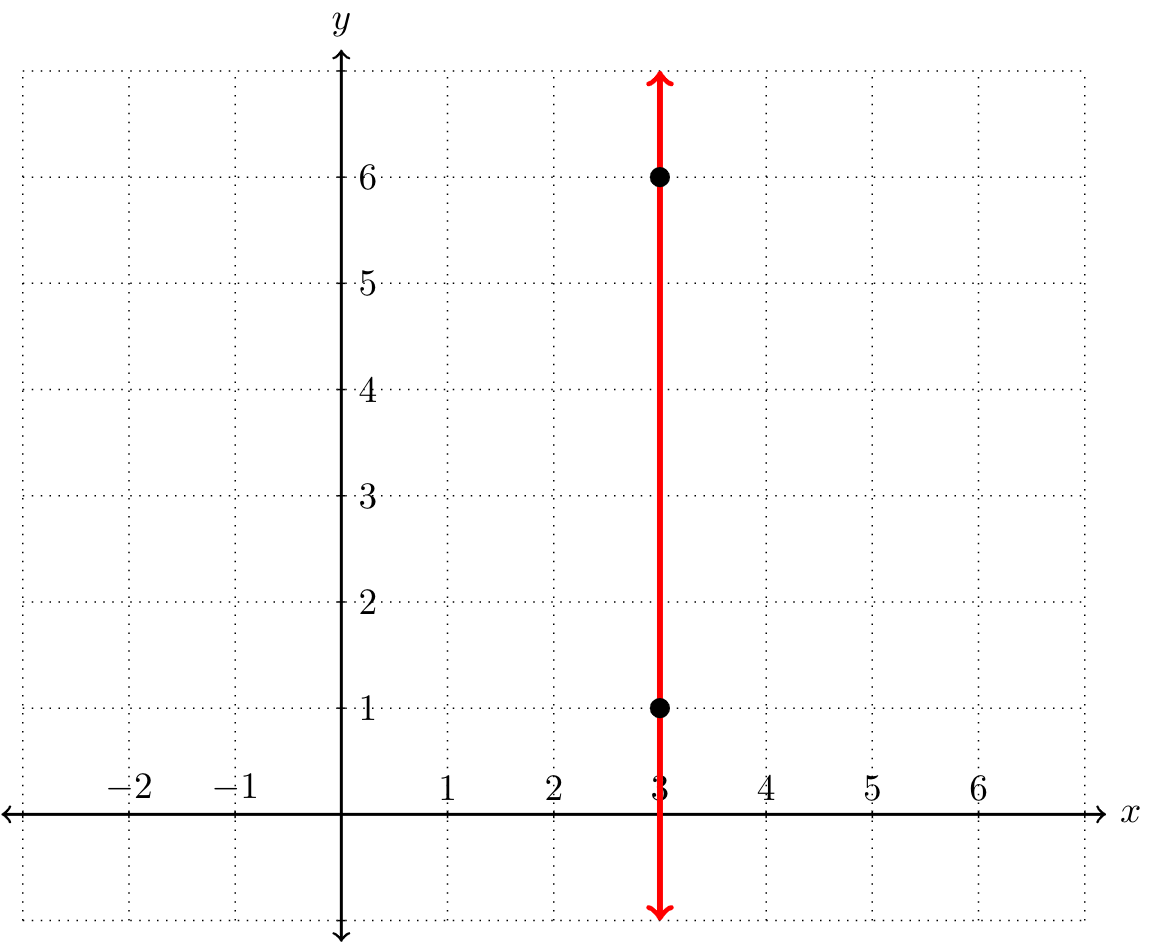
We can visually determine whether a graph represents a function using the vertical line test. If any vertical line intersects the graph more than once, then the graph does not represent a function. Returning to the previous graph, we can see that this is not a function since the points \((3,1)\) and \((3,6)\) intersect the same vertical line.
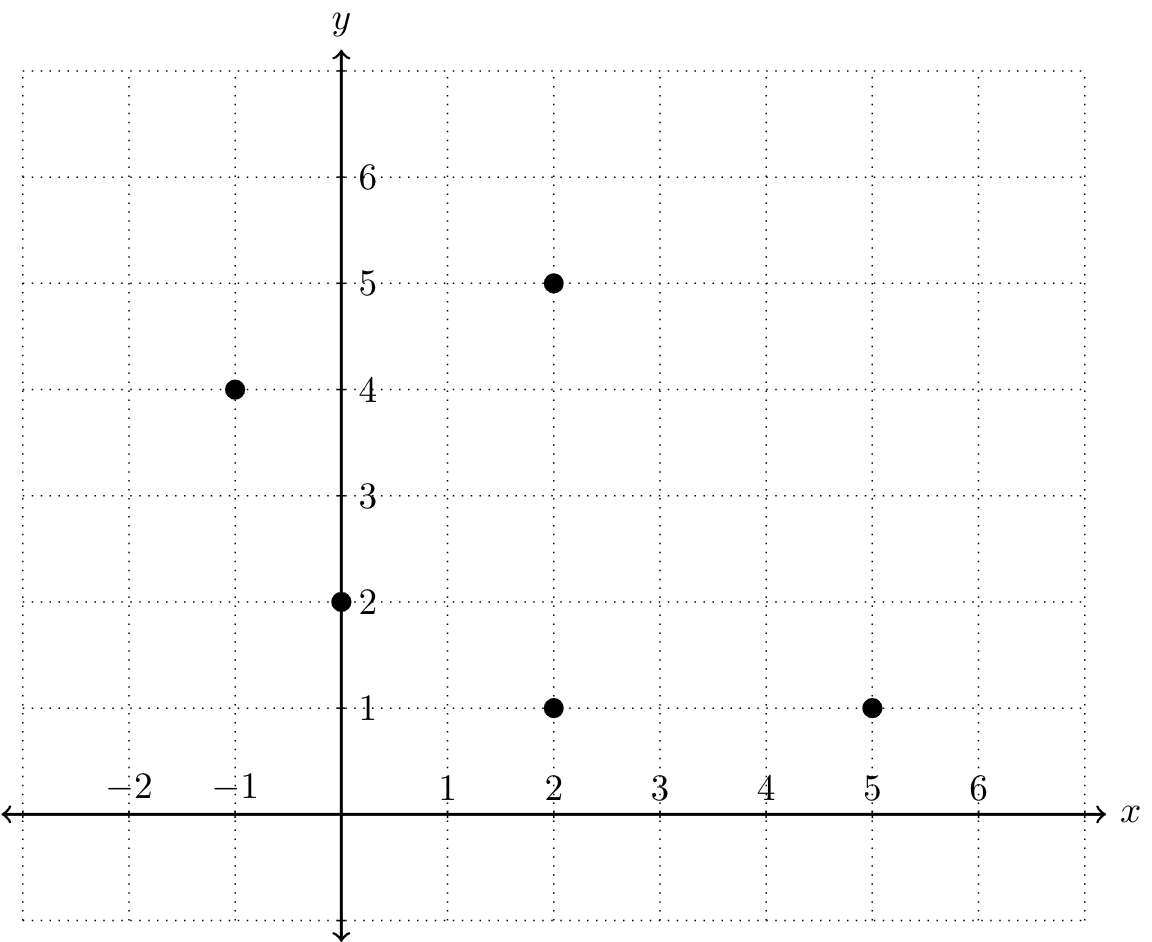
Determine whether the relation given by the graph below is a function. State the domain and range.
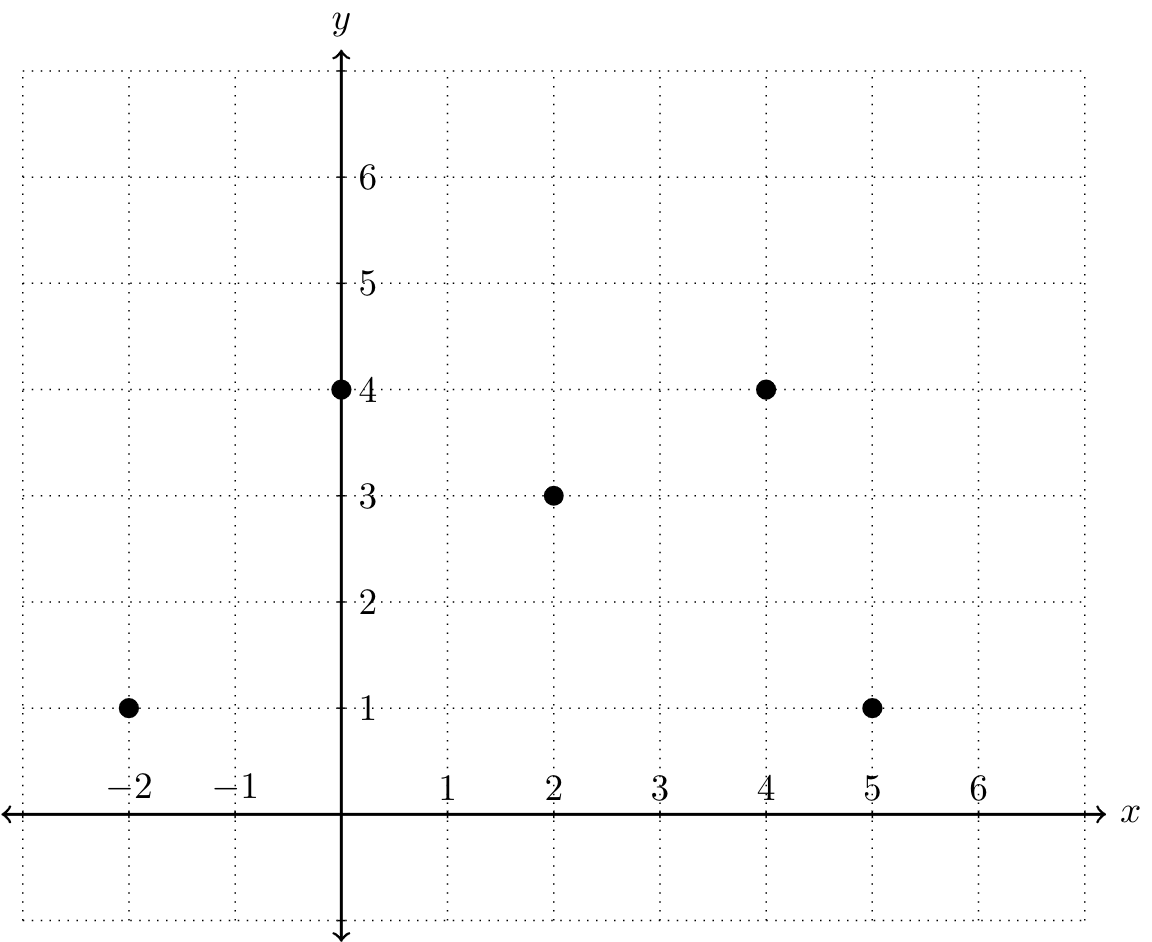
Since no vertical line can be drawn to intersect two points, this relation passes the vertical line test and is therefore a function.
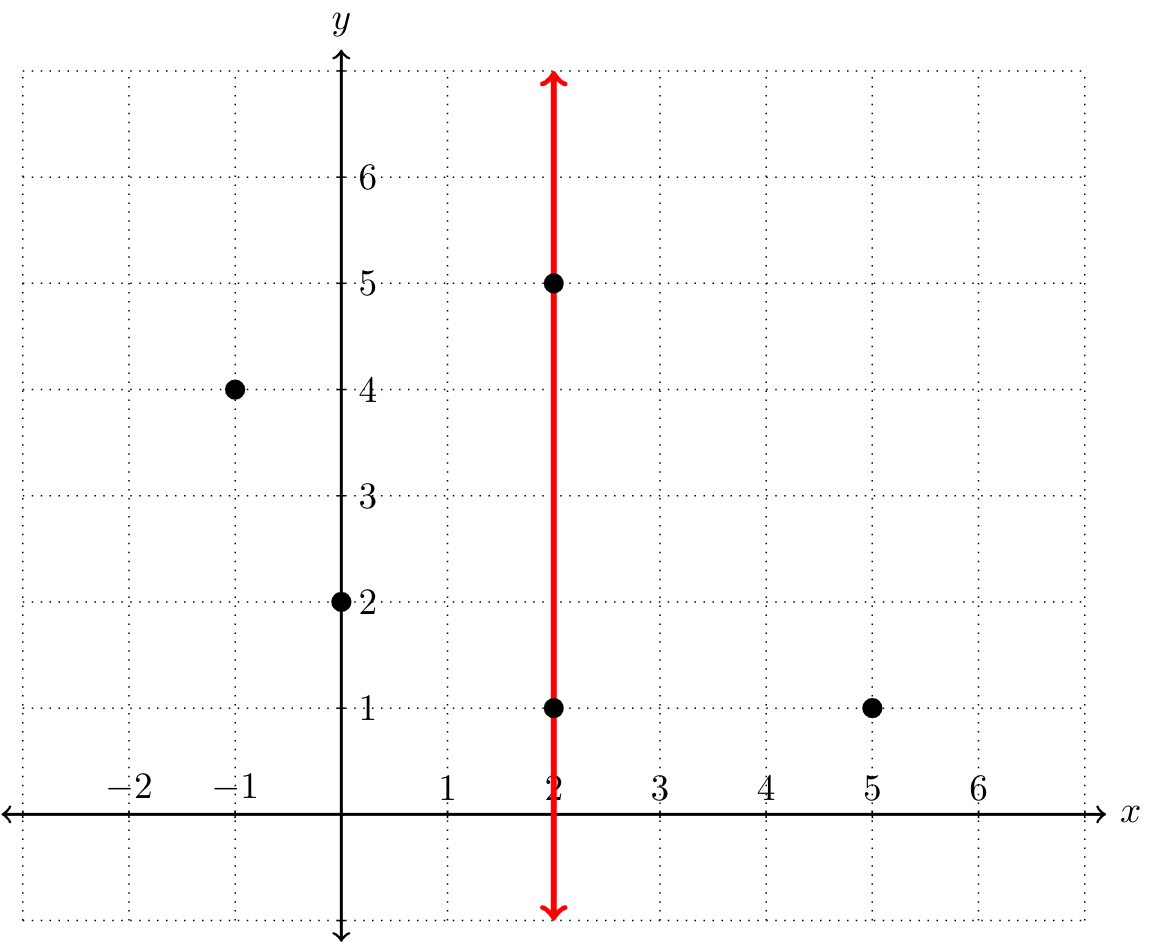
Determine whether the relation given by the graph below is a function. State the domain and range.
The vertical line \(x=2\) intersects two points of the graph, so this relation fails the vertical line test and is therefore not a function.
With the definition of a function comes special notation. If we consider each \(x\)-value to be the input that produces exactly one output, then we can use function notation:
The notation \(f(x)\) is read as, \(f\) of \(x\) and should not be confused with multiplication. If \(f(x)=y\) is a function, we say that \(y\) is a function of \(x\text{.}\)
Algebra frequently involves functions, and so the notation becomes useful when performing common tasks. Here \(f\) is the function name, and \(f(x)\) denotes the value in the range associated with the value \(x\) in the domain. Functions are often named with different letters; some common names for functions are \(f, g, h, C\text{,}\) and \(R\text{,}\) but really any letter can be used for the name of a function. We can use function notation to describe a function given in any representation, but it is most frequently seen with equation. For example, consider the function
This function relates each input \(x\) to the output \(2x-4\text{.}\) If we are looking for the output for a particular input, we can evaluate the function by plugging that value of \(x\) in. For instance,
Here the compact notation \(f(-3)=-10\) indicates that where \(x=-3\) (the input), the function results in \(y=-10\) (the output).
From above, we can see that our output depends on our input. Another way we define this is to call our input \(x\) the independent variable and our output \(y\) the dependent variable. Indeed, above, our function's output was dependent upon what the input was - when we put in \(-3\text{,}\) we got out the answer \(-10\text{.}\)
Consider the function \(M=53+14t\) where \(M\) represents miles from home on Gabby's bike trip as a function of \(t\text{,}\) the number of hours since Gabby left her office. Which is the independent variable, and which is the dependent variable?
When translating word problems to equations it may help to remember that the phrase "a function of", tells us our input, or independent variable is time \(t\text{.}\)
The independent variable is \(t\text{,}\) and the dependent variable is \(M\text{.}\)
Function notation streamlines the task of evaluating. For example, use the function \(h\) defined by \(h(x)=\frac{1}{2}x-3\) to evaluate for \(x\)-values in the set \({-2,0,7}\text{.}\)
Given any function defined by \(h(x)=y\) the input \(x\) can be any algebraic expression. For example:
Given \(g(x)=x^2\text{,}\) find \(g(-2), g\left(\frac{1}{2}\right)\text{,}\) and \(g(x+h)\text{.}\)
When evaluating, it is a best practice to begin by replacing the variables with parentheses and then substitute the appropriate values. This helps with the order of operations when simplifying expressions.
At this point, it is important to note that, in general, \(f(x+h)\neq f(x)+f(h)\text{.}\) The previous example, where \(g(x)=x^2\text{,}\) illustrates this nicely.
Given \(k(x)=\sqrt{2x+4}\text{,}\) find \(k(-2)\text{,}\) and \(k(0)\text{.}\)
Sometimes the output is given and we are asked to find the input.
Given \(f(x)=-3x+10\text{,}\) for what values of \(x\) is \(f(x)=4\text{?}\)
Here we're given the output and we're looking for the corresponding input(s). In other words, we're given \(f(x)\) and are looking for \(x\text{.}\)
Therefore \(f(2)=4\text{.}\)
We can use function notation to describe functions presented in other forms, including graphs, tables and diagrams.
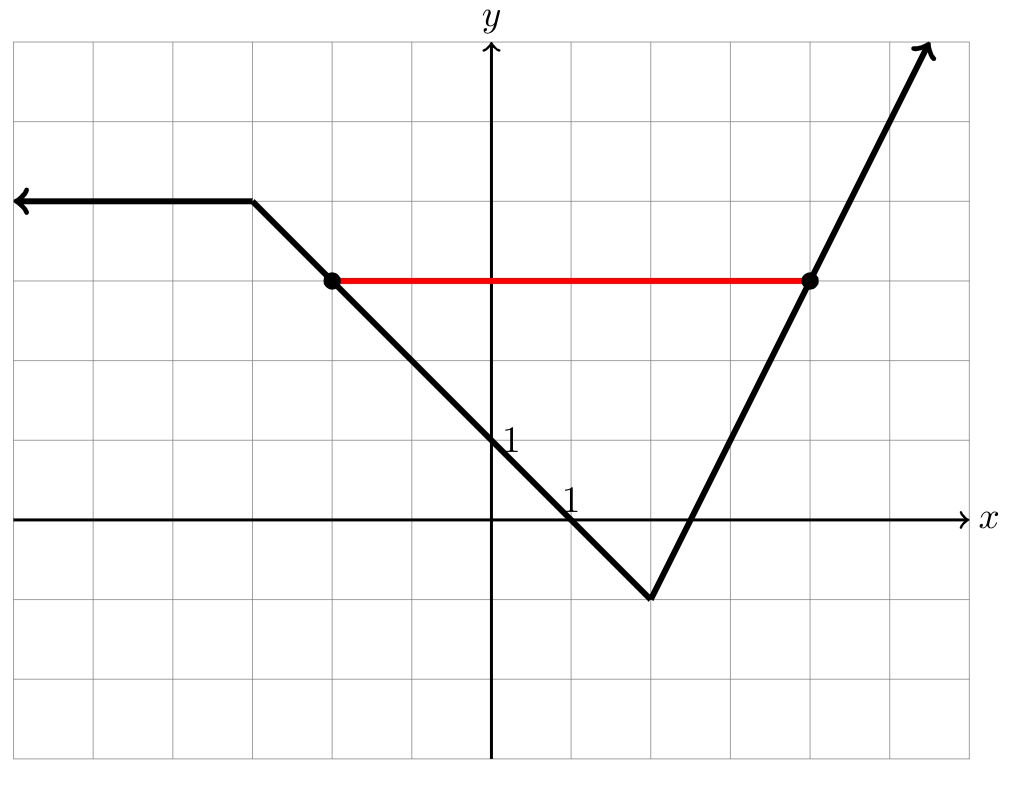
The graph below represents \(g(x)\text{.}\) Find \(g(-1),\, g(0),\) and \(g(3)\text{.}\) For what value(s) is \(g(x)\) equal to \(3\text{?}\)
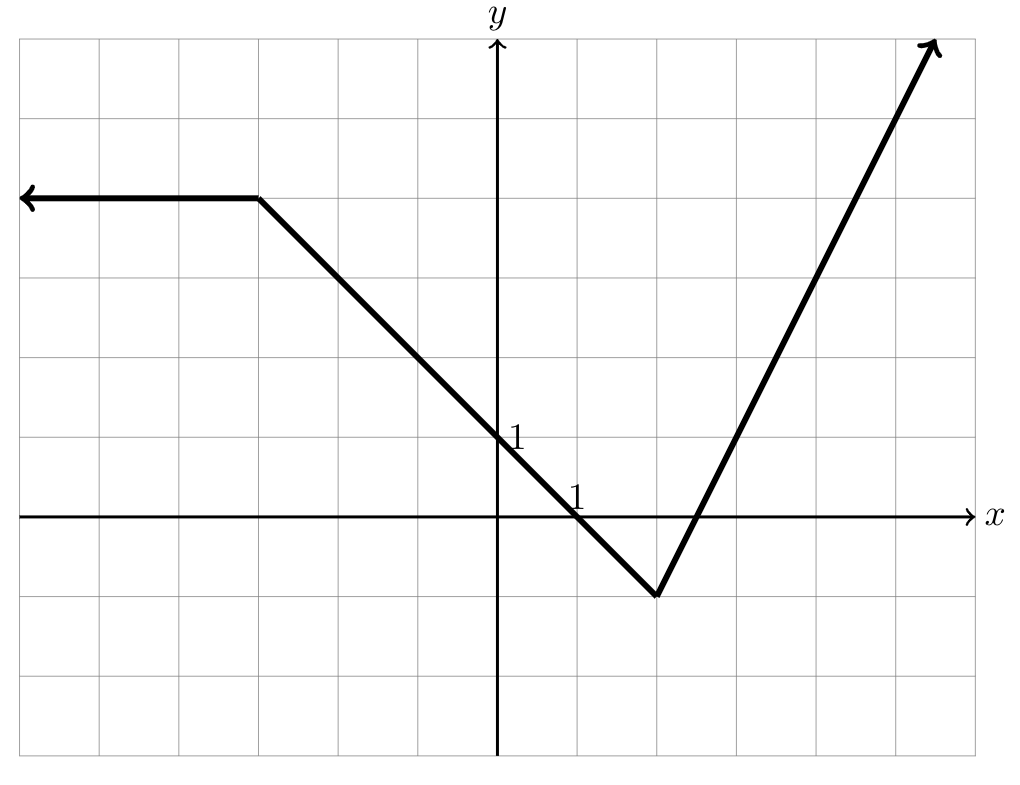
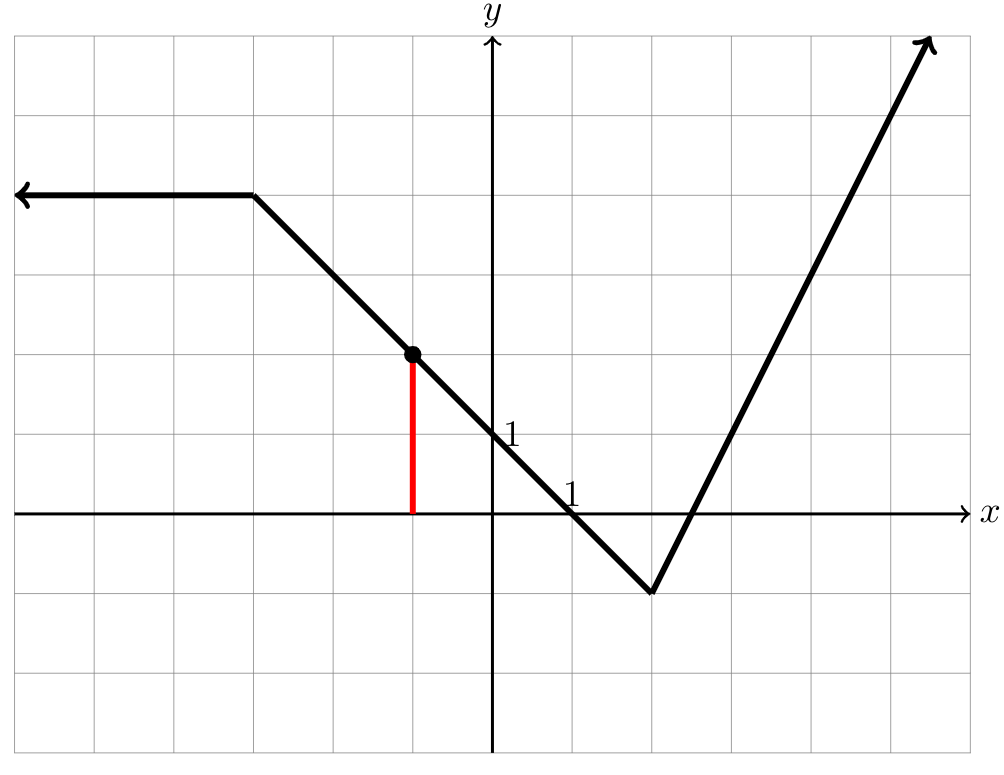
The notation \(g(-1)\) means that we are looking for the output associated with the input of \(-1\text{.}\) Graphically, this means that \(x=-1\) and we're looking for the output of such point on the graph. The only point on the graph with an input of \(-1\) is \(y=2\text{.}\) Therefore \(g(-1)=2\text{.}\)
Similarly, we find that \(g(0)=1\) and \(g(3)=1\text{.}\)
On the other hand, to find the value(s) for which \(g(x)\) is equal to \(3\text{,}\) we are looking for input(s) associated with the output of \(3\text{.}\) Graphically, this means that \(y=3\) and we're looking for the input of such points on the graph. From the graph, we can see that \(g(-2)=3\) and \(g(4)=3\text{.}\)