
Supplemental Videos
The main topics of this section are also presented in the following videos:
The main topics of this section are also presented in the following videos:
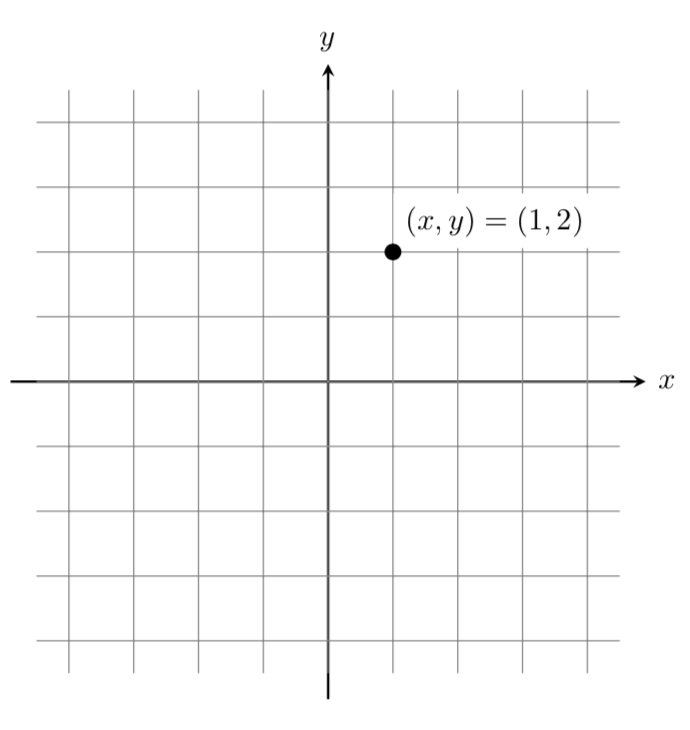
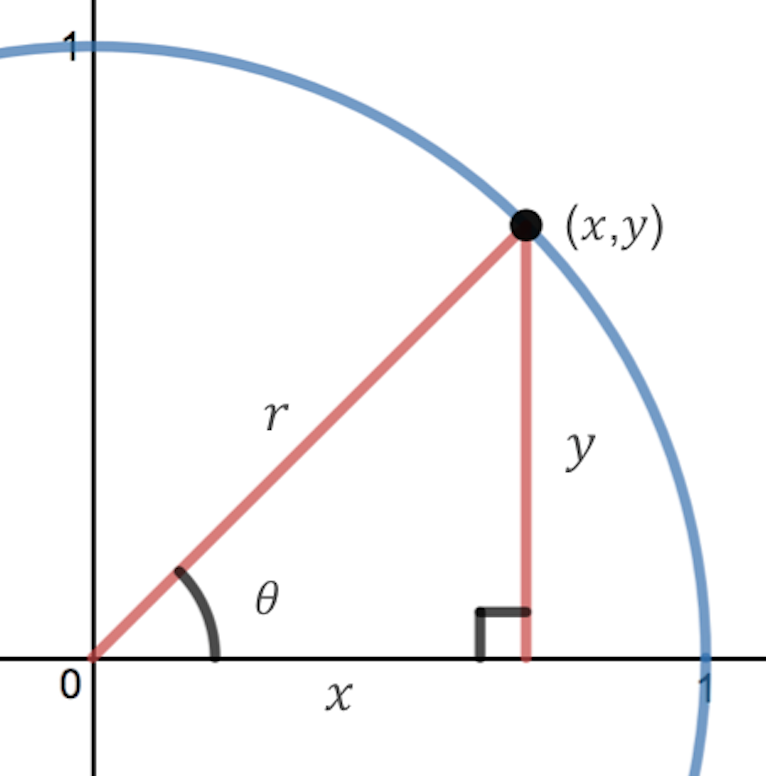
The coordinate system we are most familiar with is called the Cartesian coordinate system, a rectangular plane divided into four quadrants by horizontal and vertical axes. Cartesian coordinates identify a point on this plane by how far left or right it lies from the origin (the \(x\) coordinate) and how far above or below the origin it lies (the \(y\) coordinate).
In earlier chapters, we found the Cartesian coordinates of a point on the unit circle at a given angle from the positive horizontal axis. Sometimes an angle, along with a point's distance from the origin provides a more useful way of describing the point's location than conventional Cartesian coordinates.
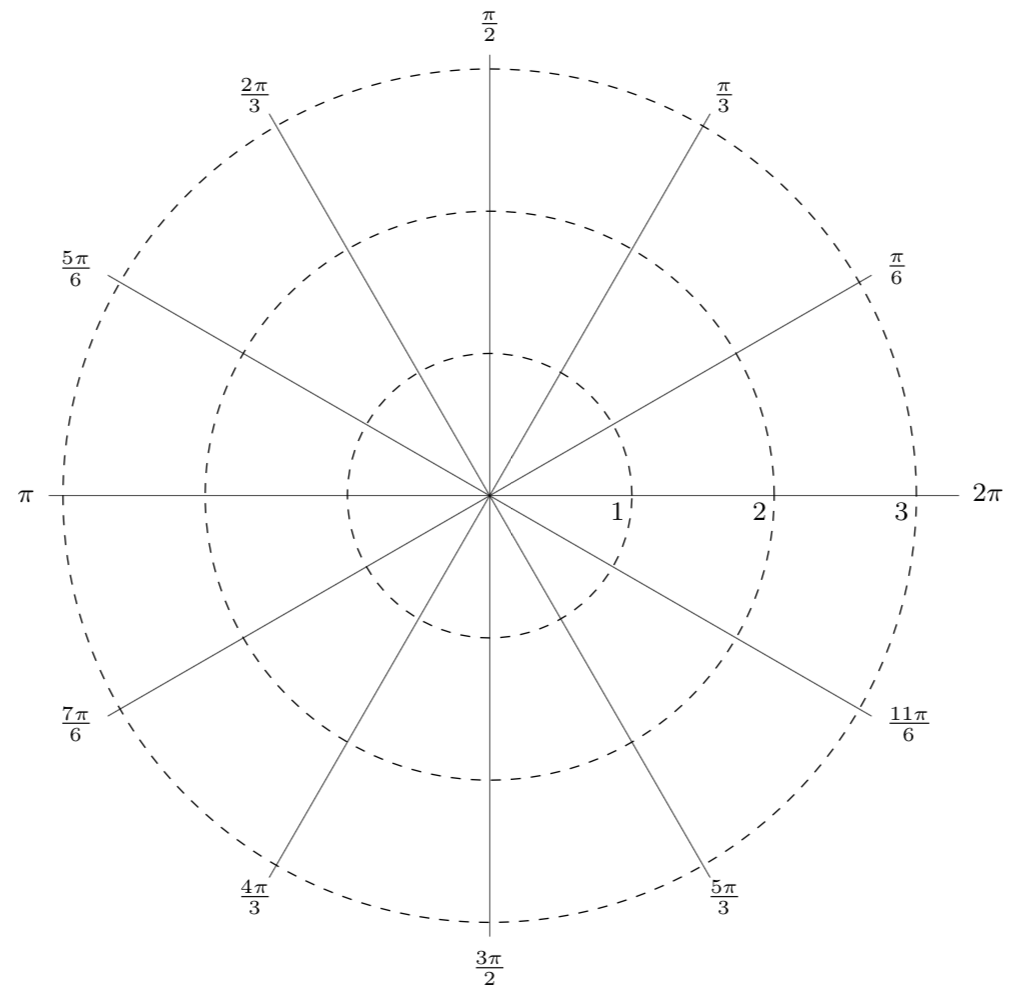
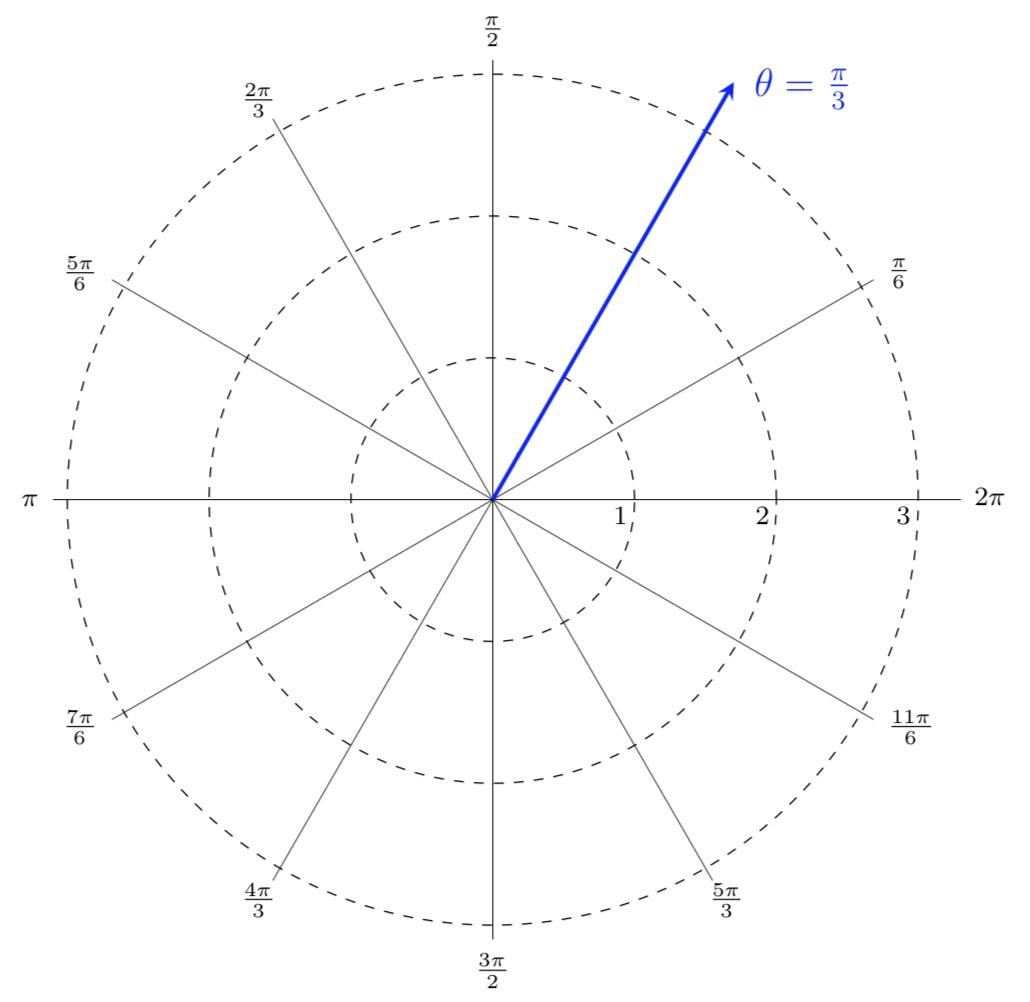
The polar coordinates of a point consist of an ordered pair, \((r,\theta)\text{,}\) where \(r\) is the distance from the point to the origin and \(\theta\) is the angle measured in standard position.
Notice that if we were to "grid" the plane for polar coordinates, it would look like the graph below, with circles at incremental radii and rays drawn at incremental angles.
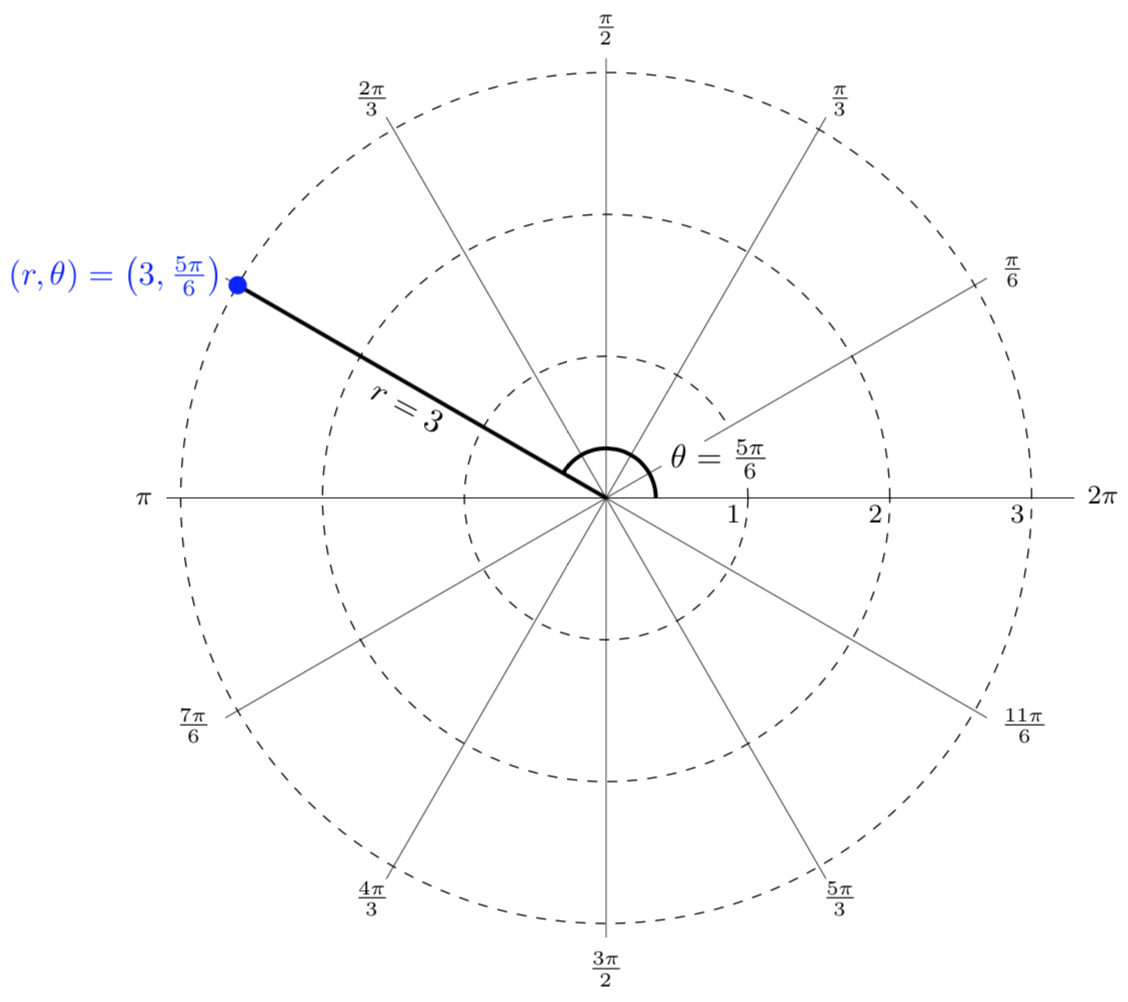
Plot the polar point \(\displaystyle \left(3,\frac{5\pi}{6}\right)\)
This point will be a distance of 3 from the origin at an angle of \(5\pi/6\text{.}\) Plotting this point we get the graph shown below.
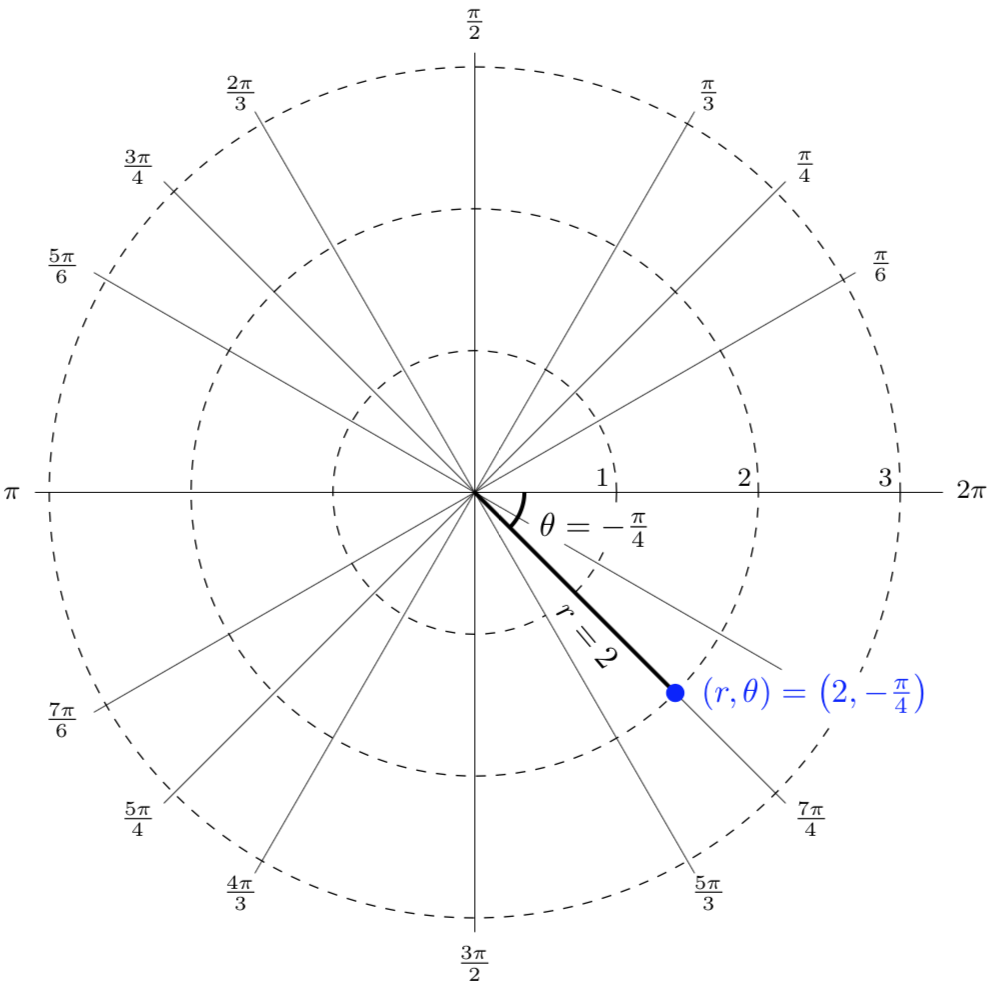
Plot the polar point \(\displaystyle \left(2,-\frac{\pi}{4}\right)\)
This point will be a distance of 2 from the origin at an angle of \(-\pi/4\text{.}\) Plotting this point we get the graph shown below.
In the previous example, we plotted the polar point \((2,-\pi/4)\text{.}\) Notice that the resulting point on the graph is the same as the polar point
Any Cartesian point can be represented by an infinite number of different polar coordinates by adding or subtracting full rotations to the \(\theta\) value of these points. For example, the same point could also be represented as
The number of different ways to represent a polar point is infinite.
To convert between polar coordinates and Cartesian coordinates, we can use the trigonometric relationships that we encountered in Chapter 1.
To convert between polar \((r,\theta)\) and Cartesian \((x,y)\) coordinates, we can use the following relationships
From these relationships and our knowledge of the unit circle, if \(r=1\) and \(\theta=\pi/3\text{,}\) the polar coordinates would be
and the corresponding Cartesian coordinates would be
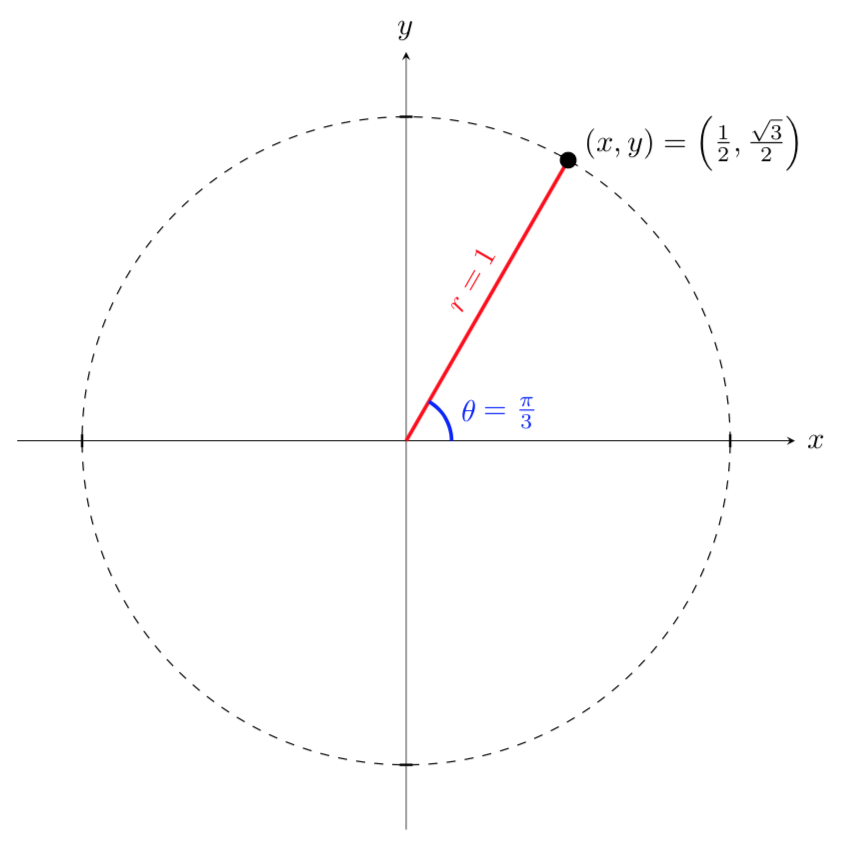
Remembering your unit circle values will come in very handy as you convert between Cartesian and polar coordinates.
Find the Cartesian coordinates of a point with the polar coordinates
Using the above relationships, the \(x\) and \(y\) coordinates of the point are
Thus, the Cartesian coordinates are
Note that since \(2\pi/3\) is a common angle on the unit circle, we can find the exact Cartesian coordinates rather than using a calculator to find approximate values for \(x\) and \(y\text{.}\)

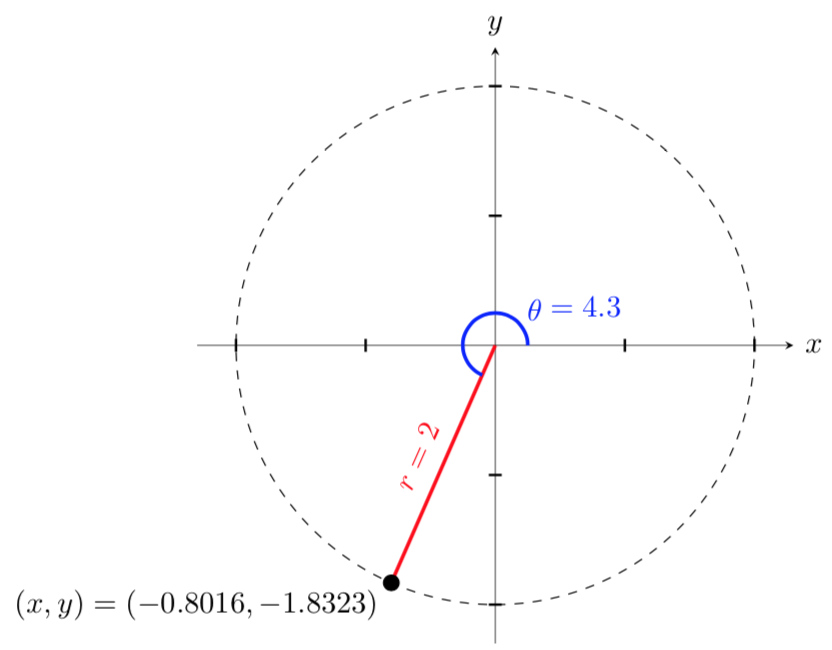
Find the Cartesian coordinates of a point with the polar coordinates
Using the above relationships, the \(x\) and \(y\) coordinates of the point are
Since \(\theta=4.3\) radians is not a common angle on the unit circle, we need to use our calculators to find approximate values for \(x\) and \(y\text{.}\) Using our calculators, we get
Thus, the Cartesian coordinates are
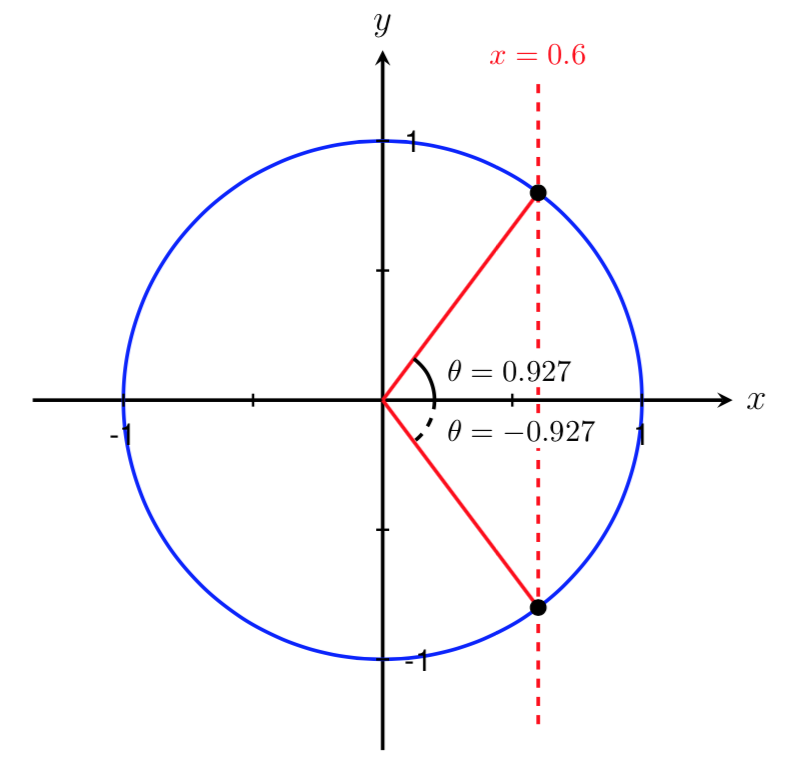
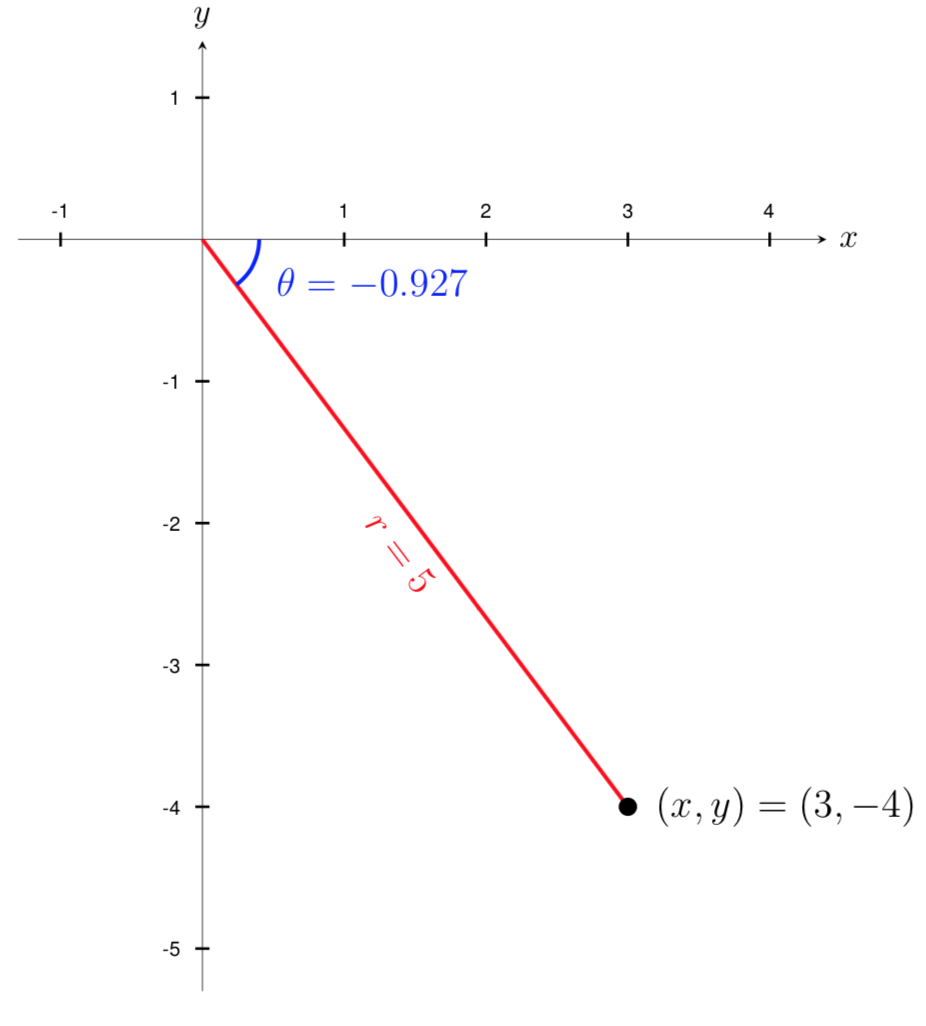
Find the polar coordinates of a point with the Cartesian coordinates
Let's start by plotting the point \((x,y)=(3,-4)\) on a graph and using the Pythagorean theorem to find the corresponding radius of the point. We get that
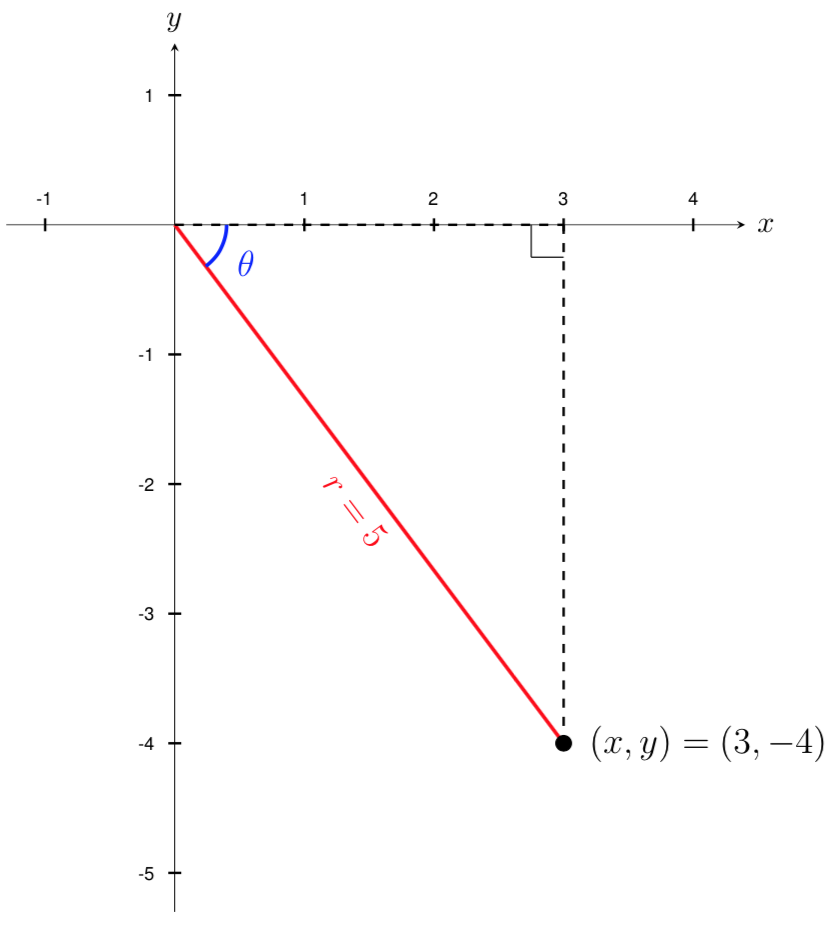
Now that we know the radius, we can find the angle using any of the three trigonometric relationships. Keep in mind that there may be more than one solution when solving for \(\theta\) and we will need to consider the quadrant that our \((x,y)\) point is in to decide which solution to use.
Using the cosine function, we get that
Since this cosine value does not correspond to a common angle on the unit circle, we must use the inverse cosine function to solve for \(\theta\text{,}\) which gives us
Since \(0.927\) is greater than 0 and less than \(\pi/2 \approx 1.571\text{,}\) we know that \(\theta=0.927\) lies in Quadrant I. Since the point \((x,y)=(3,-4)\) is located in Quadrant IV, we must find the other angle on the unit circle with \(\cos(\theta) = 0.6\)
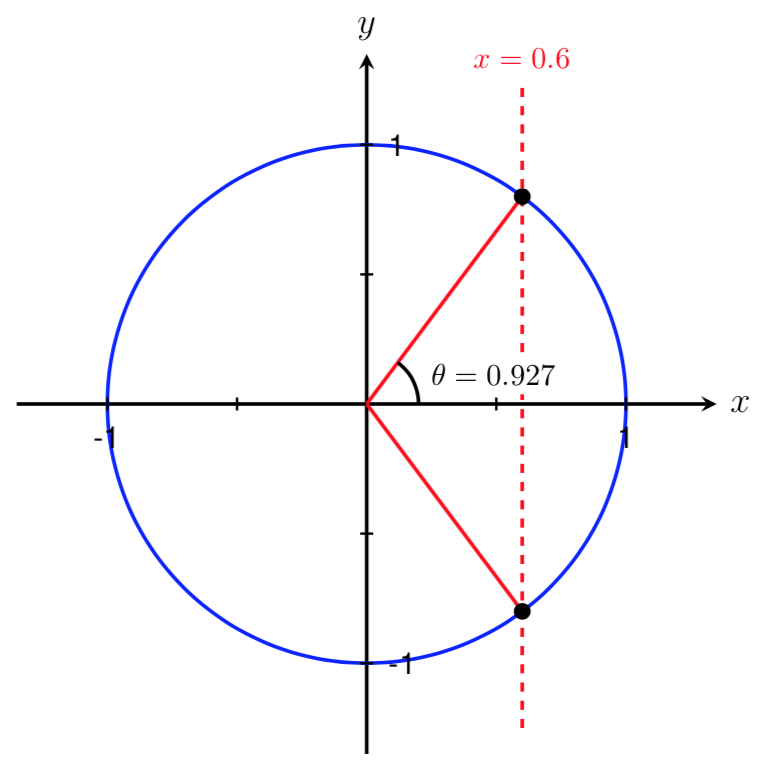
Recall from Inverse Trigonometric Functions that we can use the symmetry of the unit circle to find this second angle. By symmetry, the magnitudes of the two angles shown below are equal. Thus, \(\theta=-0.927\) is another angle that satisfies \(\cos(\theta) = 0.6\)
Therefore, the polar coordinates of the point are
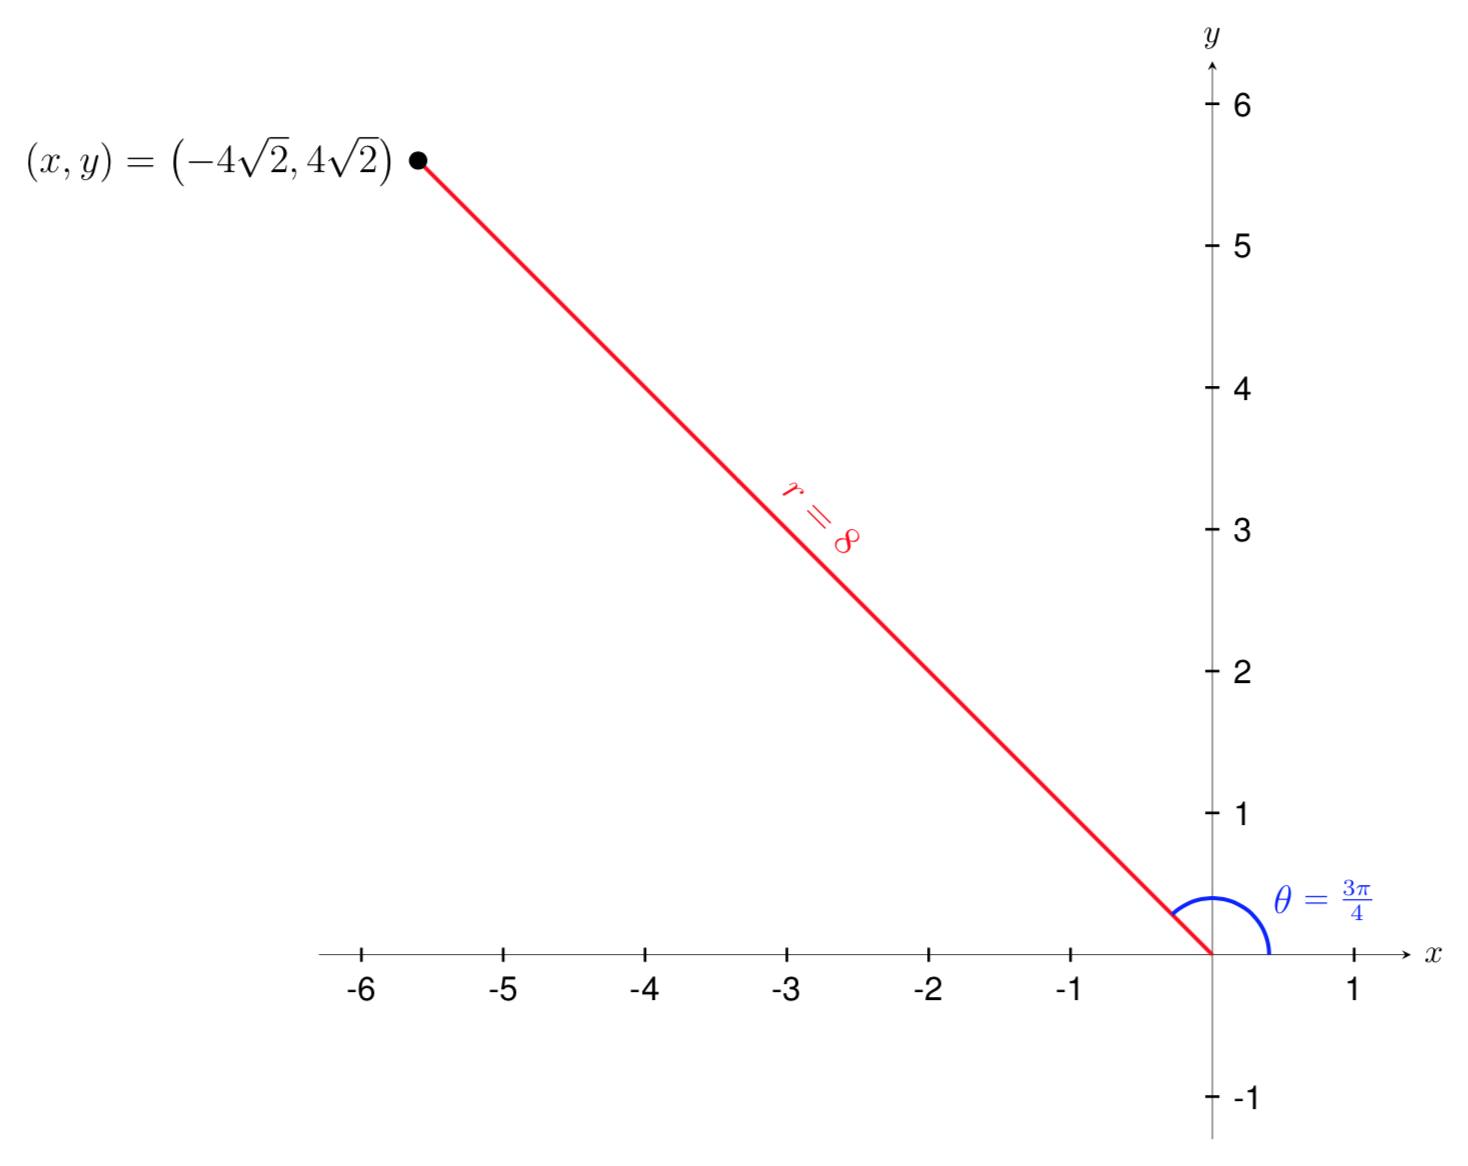
Find the polar coordinates of a point with the Cartesian coordinates
Let's start by plotting the point \((x,y)=(-4\sqrt{2},4\sqrt{2})\) on a graph and using the Pythagorean theorem to find the corresponding radius of the point. We get that
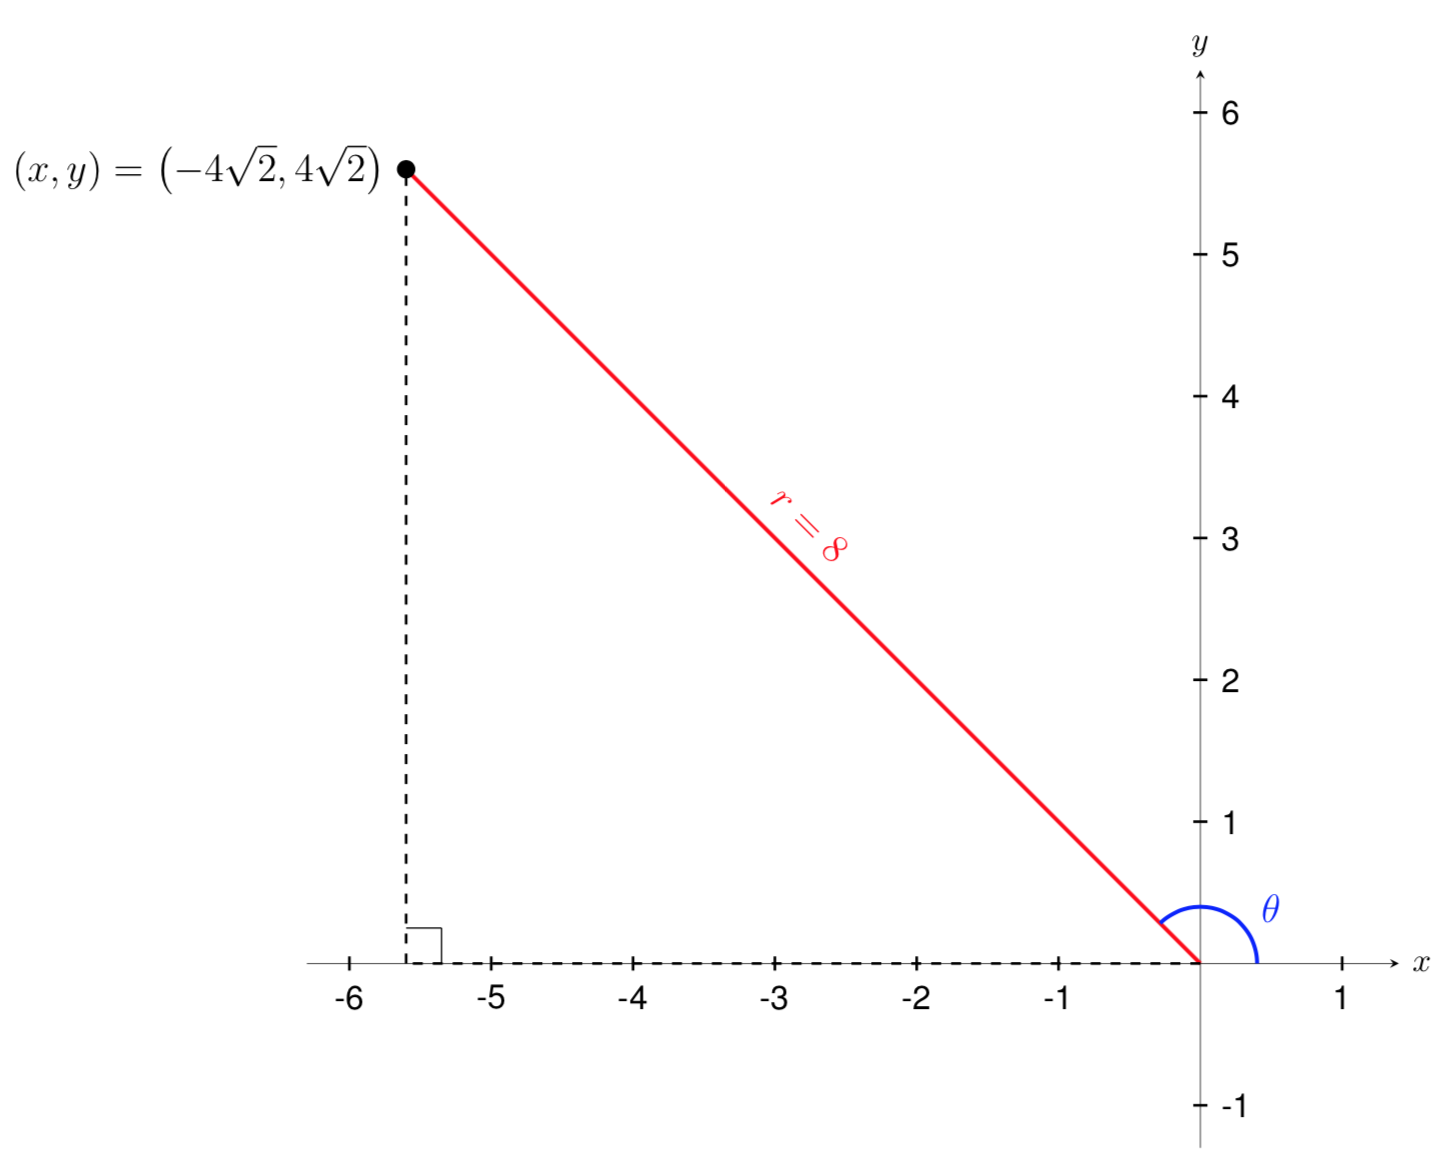
Now that we know the radius, we can find the angle using any of the three trigonometric relationships. Keep in mind that there may be more than one solution when solving for \(\theta\) and we will need to consider the quadrant that our \((x,y)\) point is in to decide which solution to use.
Using the sine function, we get that
Since \(y=\sqrt{2}/2\) corresponds to a common angle on the unit circle, we can find an exact angle. The two angles that have a sine value of \(\sqrt{2}\2\) on the unit circle are
Since the point \((x,y)=(-4\sqrt{2},4\sqrt{2})\) is located in Quadrant II, we can determine that \(\theta=3\pi/4\text{.}\) Thus, the polar coordinates are
Convert the following
Convert the polar coordinates \((r,\theta)=(2,\pi)\) to Cartesian coordinates.
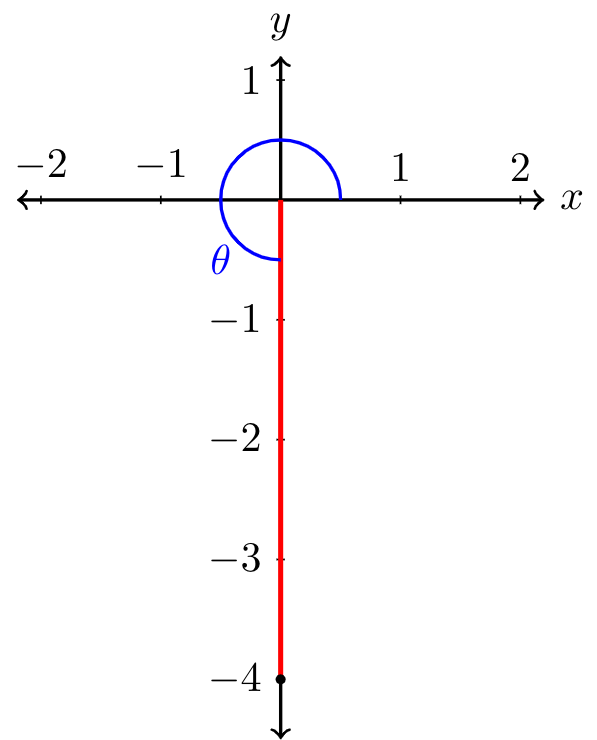
Convert the Cartesian coordinates \((x,y)=(0,-4)\) to polar coordinates.
Using the above relationships, the \(x\) and \(y\) coordinates of the point are
Therefore the Cartesian coordinates are \((x,y)=(2,0)\text{.}\)
Let's start by plotting the point \((x,y)=(0,-4)\) on a graph.
Just as a Cartesian equation like \(y=x^2\) describes a relationship between \(x\) and \(y\) values on a Cartesian grid, a polar equation can be written describing a relationship between \(r\) and \(\theta\) values on a polar grid.
There are many types of curves that can be drawn using trigonometric functions. In this section, we focus on drawing circles and rays.
Sketch a graph of the polar equation \(r=2\text{.}\)
Recall that when a variable does not show up in the equation, it does not matter what value that variable has. The output for the equation will remain the same.
For example, the Cartesian equation \(y=2\) describes all the points where \(y=2\text{,}\) no matter what the \(x\) values are, which produces a horizontal line.
Likewise, this polar equation describes all points at a distance of 2 from the origin, no matter the value of angle \(\theta\text{.}\) Therefore, this equation produces a circle of radius 2 on a polar graph.
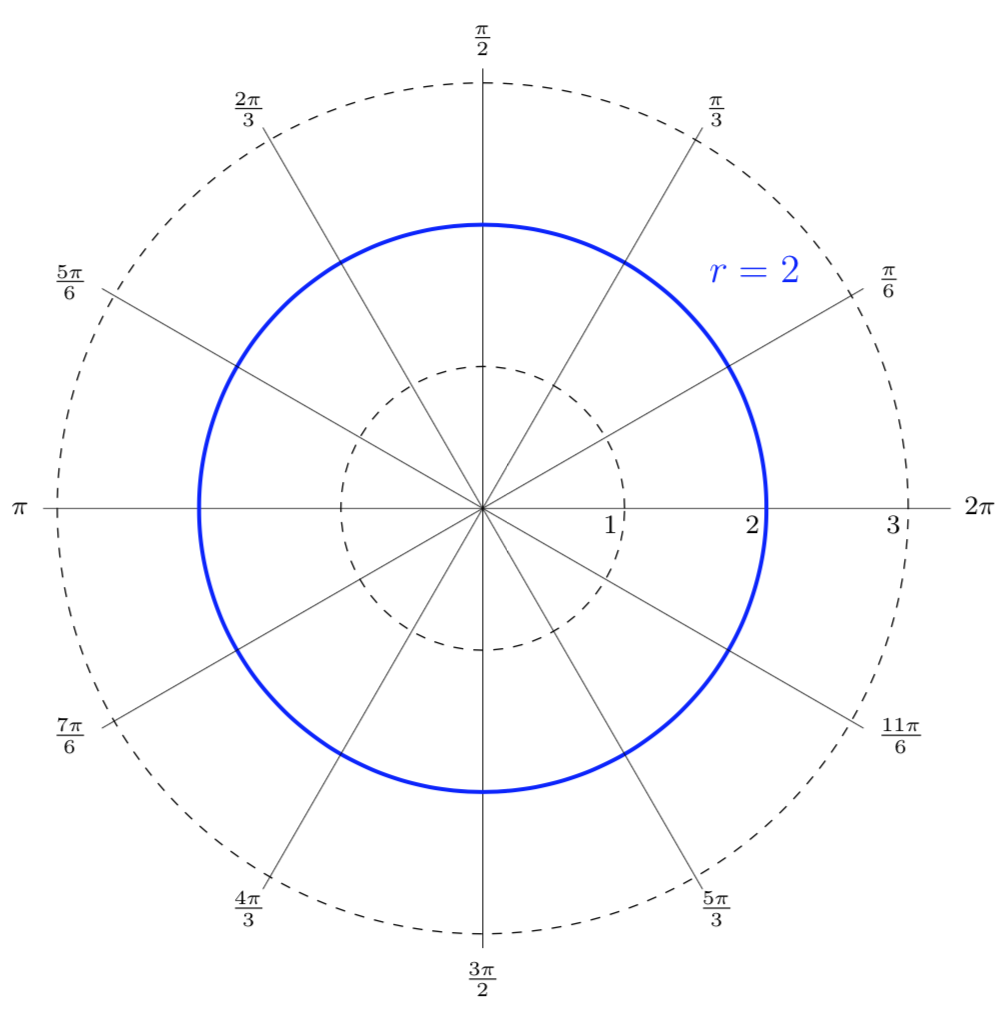
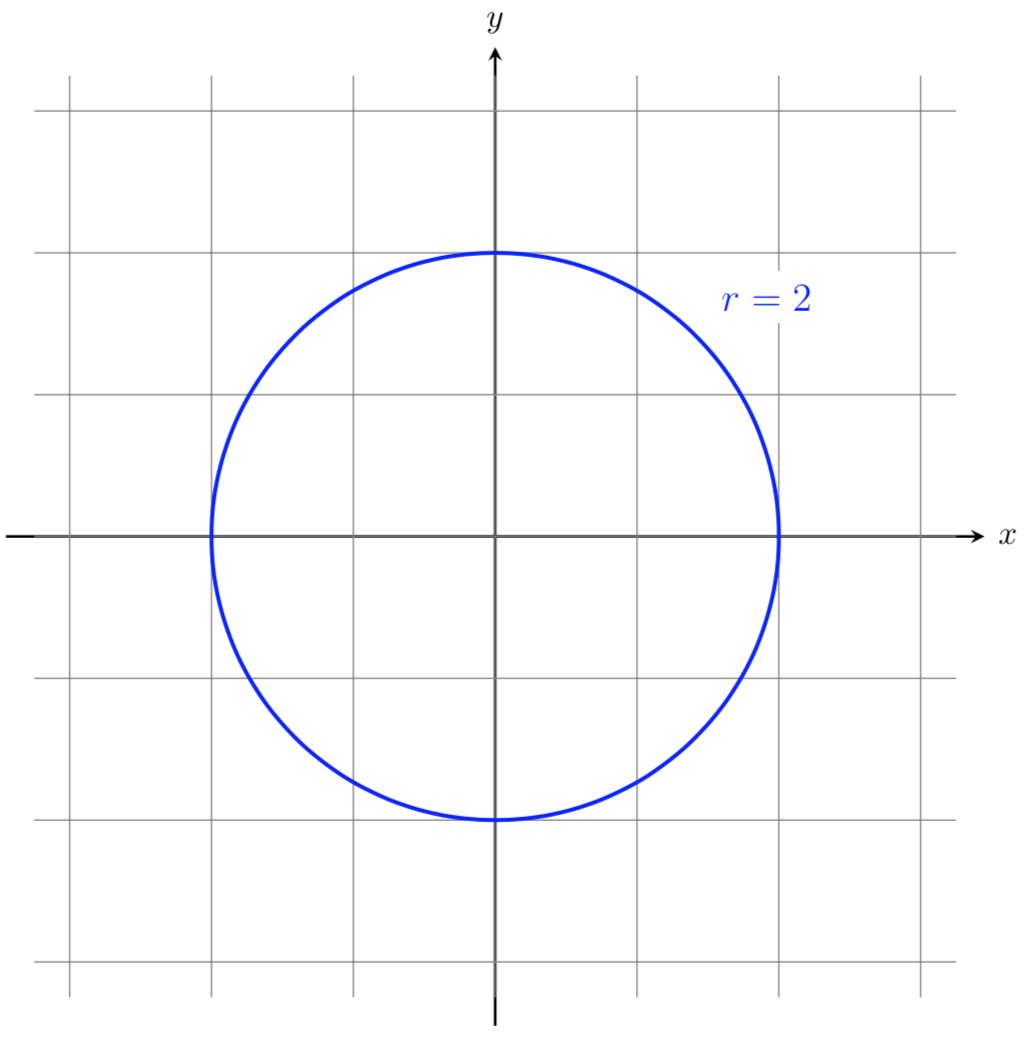
Note that we graphed the polar equation \(r=2\) on a polar grid. However, polar graphs are often graphed on a Cartesian coordinate system, as shown below. We will use both types of graphs in future examples.
Sketch a graph of the polar equation
Like the previous example, this polar equation involves only one variable, \(\theta\text{.}\) Therefore, \(\theta=\pi/3\) describes all points at an angle of \(\pi/3\) from the origin, regardless of the value of the radius, \(r\text{.}\) This equation produces a ray through the origin which makes an angle of \(\pi/3\) with the positive horizontal axis.
In addition to graphing polar equations, we can also write polar inequalities to describe regions in the plane. Sometimes, this is not easily done with Cartesian coordinates.
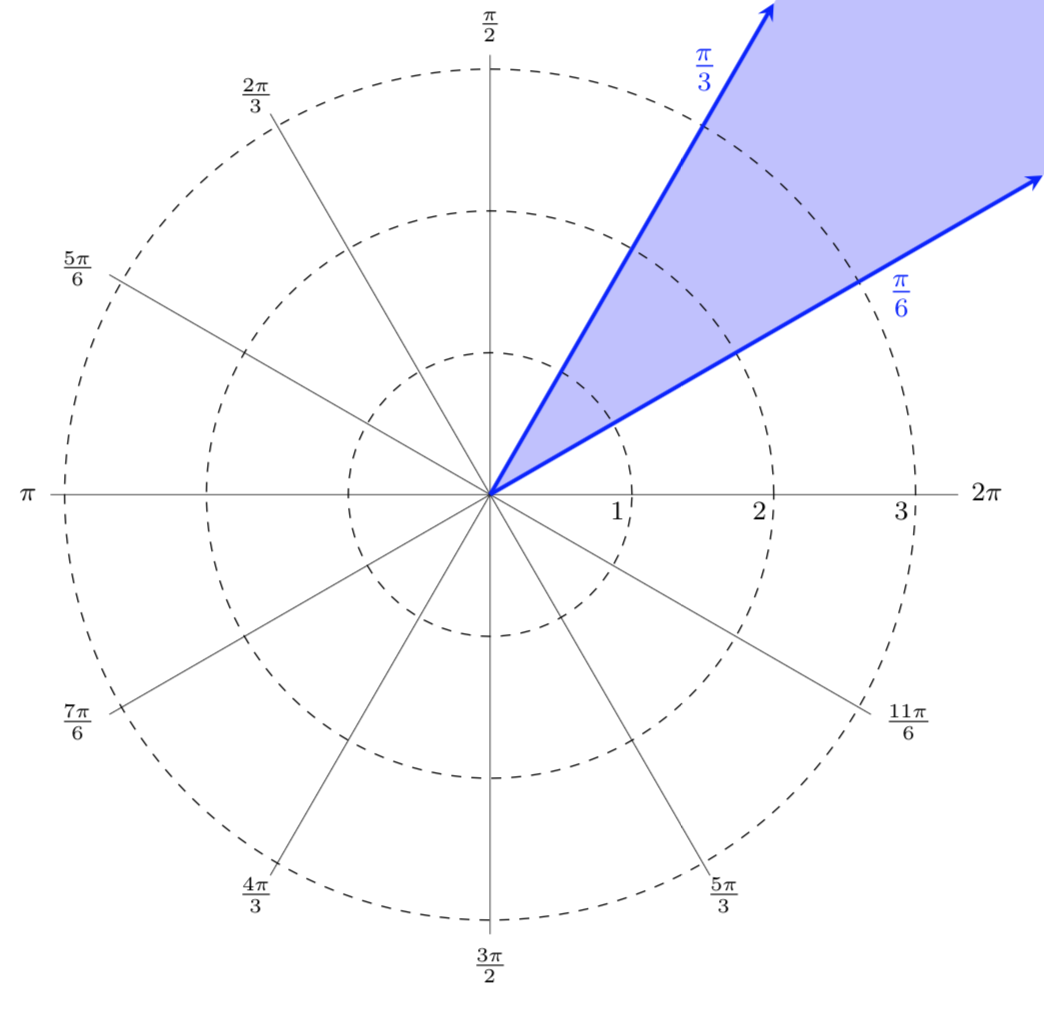
Shade the region described by the polar inequalities
In the shaded region below, \(\theta\) is restricted to be between \(\pi/6\) and \(\pi/3\) (including those angles). Within that range for \(\theta\text{,}\) all positive \(r\) values are allowed. Thus, the shaded region shown below is represented by the polar inequalities
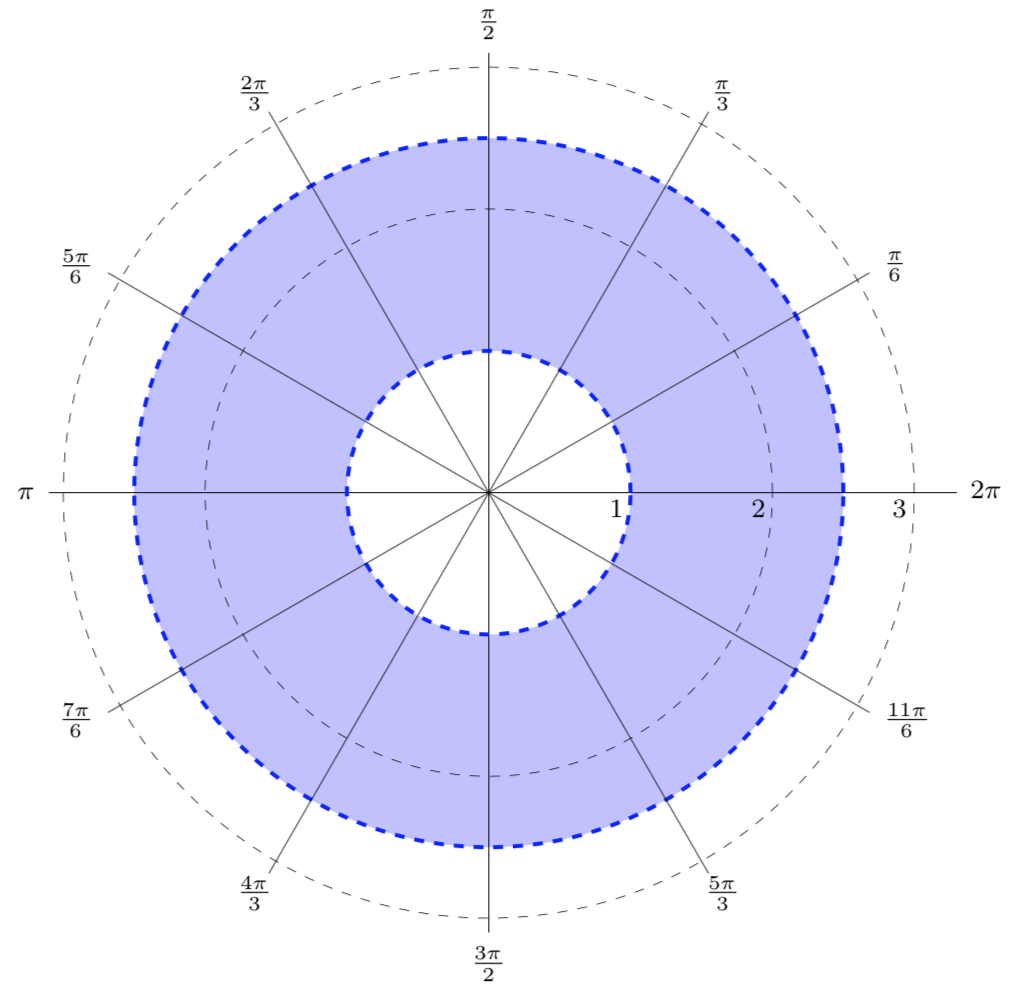
Shade the region described by the polar inequalities
In the shaded region below, \(r\) is restricted to be between \(1\) and \(2.5\text{.}\) Notice that we do not want to include the points corresponding to \(r=1\) and \(r=2.5\) so we use dashed lines instead of solid ones. Any value of \(\theta\) between \(0\) and \(2\pi\) is allowed. Thus, the washer shaped region shaded below is represented by the polar inequalities
Write a set of polar inequalities to describe the shaded region shown below.
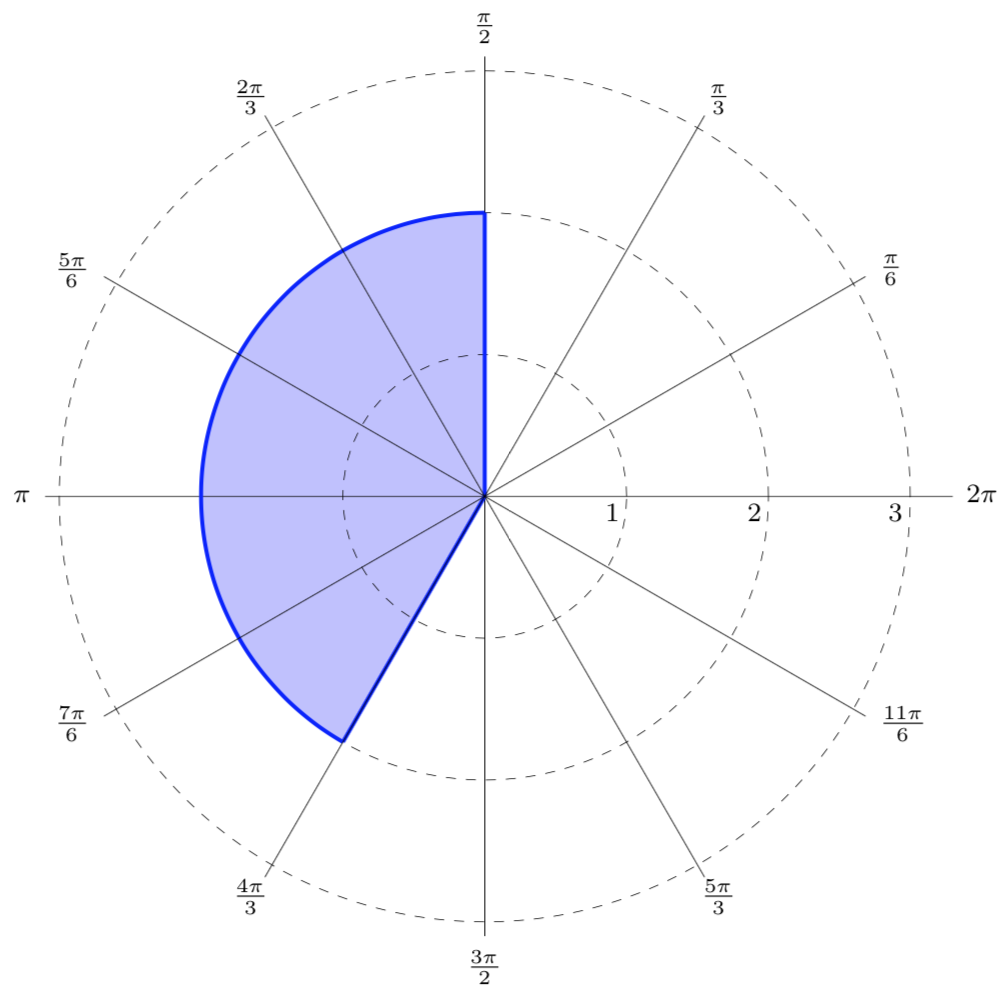
The shaded region begins at the origin and has an outer radius of 2. Therefore,
The shaded region stretches from the angle \(\pi/2\) to the angle \(4\pi/3\text{,}\) so
Putting together these bounds for \(r\) and \(\theta\) gives us the polar inequalities
Write a set of polar inequalities to describe the shaded region shown below.
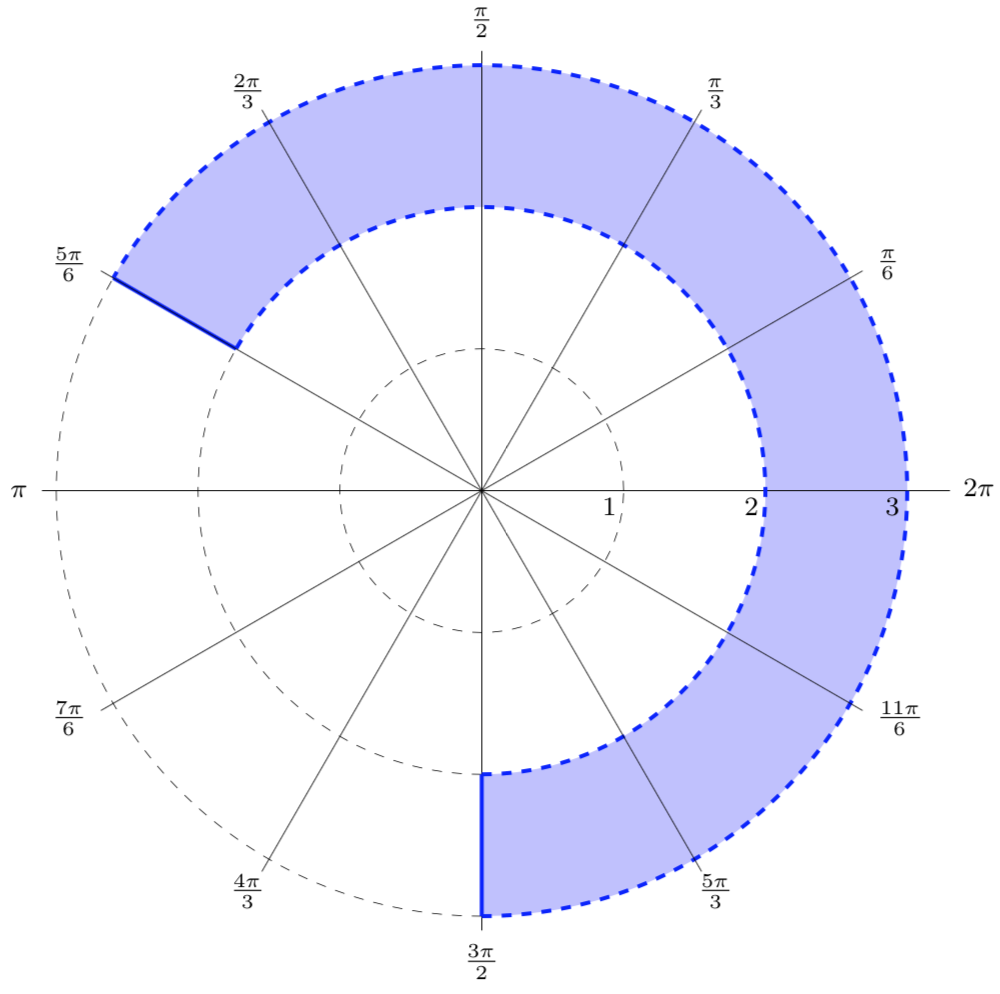
The shaded region has an inner radius of 2 and an outer radius of 3. Since there are dotted lines at these two radii, we need to use strict inequalities. Therefore,
The shaded region stretches from the angle \(3\pi/2\) to the angle \(5\pi/6\text{.}\) However, \(3\pi/2\) is greater than \(5\pi/6\text{,}\) so in order to describe the shaded region, \(\theta\) cannot be greater than \(3\pi/2\) and less than \(5\pi/6\text{.}\) Instead, we can use the angle \(-\pi/2\) as our lower bound. This gives us the inequality
Notice that \(\theta\) can equal \(-\pi/2\) and \(5\pi/6\text{,}\) as represented by the solid lines. Putting together the bounds for \(r\) and \(\theta\) gives us the polar inequalities