
Supplemental Videos
The main topics of this section are also presented in the following videos:
The main topics of this section are also presented in the following videos:
In this section, we will be using inequality notation and interval notation to describe sets of numbers. If you would like to review these notations, you can refer to Linear Inequalities.
Here is a quick review of intervals.
An interval is a set that consists of all the real numbers between two numbers \(a\) and \(b\text{.}\)
The set \(-2 \le x \le 2\) includes its endpoints \(-2\) and \(2\text{,}\) so we call it a closed interval, and we denote it by \([-2, 2]\) (see Figure56a). The square brackets tell us that the endpoints are included in the interval. An interval that does not include its endpoints, such as \(-2 \lt x \lt 2\text{,}\) is called an open interval, and we denote it with round brackets, \((-2, 2)\) (see Figure56b).
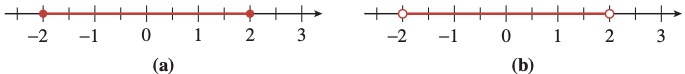
Do not confuse the open interval \((-2, 2)\) with the point \((-2, 2)\text{!}\) The notation is the same, so you must decide from the context whether an interval or a point is being discussed.
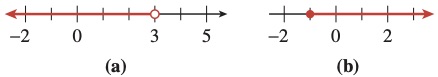
We can also discuss infinite intervals, such as \(x\lt 3\) and \(x\ge -1\text{,}\) shown in Figure58. We denote the interval \(x\lt 3\) by \((-\infty, 3)\text{,}\) and the interval \(x\ge -1\) by \([-1, \infty)\text{.}\) The symbol \(\infty\text{,}\) for infinity, does not represent a specific real number but rather indicates that the interval continues forever along the real line. Because of this, we will always use a round bracket along side \(\pm \infty\text{.}\)
Some intervals are closed on one end and open on the other. We call such an interval a half-open or half-closed interval. Some examples of half-open/half-closed intervals are \([-2,9)\) and \((0,23]\text{.}\)
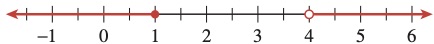
Finally, we can combine two or more intervals into a larger set. For example, the set consisting of \(x\lt -1\) or \(x\gt 2\text{,}\) shown in Figure59, is the union of two intervals and is denoted by \((-\infty,-2) \cup (2,\infty)\text{.}\)

Many solutions of inequalities are intervals or unions of intervals.
Write each of the solution sets with interval notation and graph the solution set on a number line.
\(3 \le x \lt 6\)
\(x \ge -9\)
\(x\le 1 ~\text{ or }~ x\gt 4\)
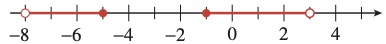
\(-8 \lt x \le -5 ~\text{ or }~ -1 \le x \lt 3\)
\([3, 6)\text{.}\) (See Figure61.)

\([-9,\infty)\text{.}\) We always use round brackets next to the symbol \(\infty\) because \(\infty\) is not a specific number and is not included in the set. (See Figure62.)

\((-\infty, 1] \cup (4, \infty)\text{.}\) The word or describes the union of two sets. (See Figure63.)
\((-8,-5] \cup [-1, 3)\text{.}\) (See Figure64.)
Now that we have reviewed interval notation we are positioned to talk about domain and range.
Consider the graph of the function \(f (x) =\sqrt{x + 4}\) and observed that \(f (x)\) is undefined for \(x\)-values less than \(-4\text{.}\) For this function, we must choose \(x\)-values in the interval \([-4, \infty)\text{.}\)

All the points on the graph have \(x\)-coordinates greater than or equal to \(-4\text{,}\) as shown in Figure54. The set of all permissible values of the input variable is called the domain of the function \(f\text{.}\)
We also see that there are no points with negative \(f (x)\)-values on the graph of \(f\text{:}\) all the points have \(f (x)\)-values greater than or equal to zero. The set of all outputs or function values corresponding to the domain is called the range of the function. Thus, the domain of the function \(f (x) =\sqrt{x + 4}\) is the interval \([-4, \infty)\text{,}\) and its range is the interval \([0, \infty)\text{.}\) In general, we make the following definitions.
The domain of a function is the set of permissible values for the input variable. The range is the set of function values (that is, values of the output variable) that correspond to the domain values.
Using the notions of domain and range, we restate the definition of a function as follows.
A relationship between two variables is a function if each element of the domain is paired with exactly one element of the range.
We can identify the domain and range of a function from its graph. The domain is the set of \(x\)-values of all points on the graph, and the range is the set of \(y\)-values.
Determine the domain and range of the function \(h\) graphed in Figure56.
For the indicated points, show the domain values and their corresponding range values in the form of ordered pairs.


Figure57 shows the graph of the function \(h\) in Example55 with the domain values marked on the horizontal axis and the range values marked on the vertical axis. Imagine a rectangle whose length and width are determined by those segments, as shown in Figure57. All the points \((v, h(v))\) on the graph of the function lie within this rectangle.
The rectangle described above is a convenient window in the plane for viewing the function. Of course, if the domain or range of the function is an infinite interval, we can never include the whole graph within a viewing rectangle and must be satisfied with studying only the important parts of the graph.
Draw the smallest viewing window possible around the graph shown below. Then find the domain and range of the function.

The domain is \([-4, 2]\) and the range is \([-6, 10]\)

Sometimes the domain is given as part of the definition of a function.
Graph the function \(f (x) = x^2 - 6\) on the domain \(0 \le x \le 4\) and give its range.
The graph is part of a parabola that opens upward. We obtain several points on the graph by evaluating the function at convenient \(x\)-values in the domain.
| \(x\) | \(f(x)\) | ||
| \(0\) | \(-6\) | \(\text{since } f(\alert{0})=\alert{0}^2-6=-6\) | |
| \(1\) | \(-5\) | \(\text{since } f(\alert{1})=\alert{1}^2-6=-5\) | |
| \(2\) | \(-2\) | \(\text{since } f(\alert{2})=\alert{2}^2-6=-2\) | |
| \(3\) | \(3\) | \(\text{since } f(\alert{3})=\alert{3}^2-6=3\) | |
| \(4\) | \(10\) | \(\text{since } f(\alert{4})=\alert{4}^2-6=10\) |
The range of the function is the set of all \(f (x)\)-values that appear on the graph. We can see in Figure61 that the lowest point on the graph is \((0, -6)\text{,}\) so the smallest \(f (x)\)-value is \(-6\text{.}\) The highest point on the graph is \((4, 10)\text{,}\) so the largest \(f (x)\)-value is \(10\text{.}\) Thus, the range of the function \(f\) is the interval \([-6, 10]\text{.}\)

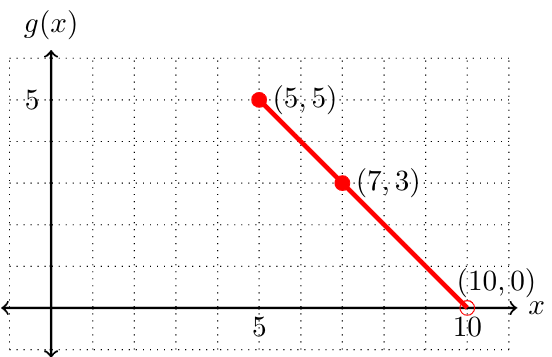
Graph the function \(g (x) = -x+10\) on the domain \(5 \le x \lt 10\) and give its range.
The graph is part of a line with a negative slope. We obtain several points on the graph by evaluating the function at convenient \(x\)-values in the domain.
| \(x\) | \(f(x)\) | ||
| \(5\) | \(5\) | \(\text{since } g(\alert{5})=-\alert{5}+10=5\) | |
| \(7\) | \(3\) | \(\text{since } g(\alert{7})=-\alert{7}+10=3\) | |
| \(10\) | \(0\) | \(\text{since } g(\alert{10})=-\alert{10}+10=0\) |
The range of the function is the set of all \(g (x)\)-values that appear on the graph. We can see in the graph that the highest point is \((5, 5)\text{,}\) so the largest \(g (x)\)-value is \(5\text{.}\) We can also see that the smallest \(g(x)\)-value is as close to (10,0) as we can get coming from above, but not quite reaching (10,0). Since we also have all \(g(x)\)-values between 0 and 10, the range of the function \(g\) is the interval \((0, 5]\text{.}\) Note that the parenthesis is to indicate that we do not quite reach 0 while the bracket on the 5 shows that we achieve the value 5.
Graph the function \(g(x) = x^3 - 4\) on the domain \([-2, 3]\) and give its range.
The graph of \(g\) on the domain \([-2,3]\) is shown below. We can see that the range is \([-12, 23]\)

Not all functions have domains and ranges that are intervals.
The table gives the postage for sending printed material by first-class mail in 2016. Graph the postage function \(p = g(w)\text{.}\)
| Weight in ounces \((w)\) | Postage \((p)\) |
| \(0 \lt w \le 1 \) | $0.47 |
| \(1 \lt w \le 2 \) | $0.68 |
| \(2 \lt w \le 3 \) | $0.89 |
| \(3 \lt w \le 4 \) | $1.10 |
| \(4 \lt w \le 5 \) | $1.31 |
| \(5 \lt w \le 6 \) | $1.52 |
| \(6 \lt w \le 7 \) | $1.73 |
From the table, we see that articles of any weight up to \(1\) ounce require $0.47 postage. This means that for all \(w\)-values greater than \(0\) but less than or equal to \(1\text{,}\) the \(p\)-value is \(0.47\text{.}\) Thus, the graph of \(p = g(w)\) between \(w = 0\) and \(w = 1\) looks like a small piece of the horizontal line \(p = 0.47\text{.}\) Similarly, for all \(w\)-values greater than \(1\) but less than or equal to \(2\text{,}\) the \(p\)-value is \(0.68\text{,}\) so the graph on this interval looks like a small piece of the line \(p = 0.68\text{.}\) Continue in this way to obtain the graph shown in Figure66.

The open circles at the left endpoint of each horizontal segment indicate that that point is not included in the graph; the closed circles are points on the graph. For instance, if \(w = 3\text{,}\) the postage, \(p\text{,}\) is $0.89, not $1.10. Consequently, the point \((3, 0.89)\) is part of the graph of \(g\text{,}\) but the point \((3, 1.10)\) is not.
Postage rates are given for all weights greater than \(0\) ounces up to and including \(7\) ounces, so the domain of the function is the half-open interval \((0, 7]\text{.}\) (The domain is an interval because there is a point on the graph for every \(w\)-value from \(0\) to \(7\text{.}\)) The range of the function is not an interval, however, because the possible values for \(p\) do not include all the real numbers between \(0.3\) and \(1.75\text{.}\) The range is the set of discrete values \(0.47\text{,}\) \(0.68\text{,}\) \(0.89\text{,}\) \(1.10\text{,}\) \(1.31\text{,}\) \(1.52\text{,}\) and \(1.73\text{.}\)
Let \(B(w)\) give the residential water bill in Arid, New Mexico after using \(w\) HCF (hundreds of cubic feet) of water:
This is an example of a piecewise formula that we will talk more about later. However, for the time being we can try to make sense of the formula to answer the following question.
If the utilities commission imposes a cap on monthly water consumption at \(120\) HCF, find the domain and range of the function \(B(w)\text{.}\)
Since water consumption is capped at \(120\) HCF, the water consumption is anywhere between \(0\) and \(120\text{;}\) this means that the domain of this function is \([0,120]\text{.}\)
For the range, we can consider each of the two "pieces" separately. Graphing the line \(y=30+2w\) on the domain \(0\leq w\leq 50\text{,}\) we see that the range of this piece is \([30, 130]\text{.}\) If we graph the line \(y=50+3w\) on the domain \(50\lt w\leq 120\text{,}\) we see that the range of this piece is \((200, 410]\text{.}\) All together, this means that the range is \([30, 130]\cup(200,410]\text{.}\)
If the domain of a function is not given as part of its definition, we assume that the domain is as large as possible. We include in the domain all \(x\)-values that make sense when substituted into the function's formula.
For example, the domain of the function \(f (x) =\sqrt{9 - x^2}\) is the interval \([-3, 3]\text{,}\) because \(x\)-values less than \(-3\) or greater than \(3\) result in square roots of negative numbers. You may recognize the graph of \(f\) as the upper half of the circle \(x^2 + y^2 = 9\text{,}\) as shown in Figure68.

Find the domain of the function \(g(x) = \dfrac{1}{x-3}\text{.}\)
We must omit any \(x\)-values that do not make sense in the function's formula. Because division by zero is undefined, we cannot allow the denominator of \(\dfrac{1}{x-3}\) to be zero. Since \(x - 3 = 0\) when \(x = 3\text{,}\) we exclude \(x = 3\) from the domain of \(g\text{.}\) Thus, the domain of \(g\) is the set of all real numbers except \(3\text{.}\)
This function will be undefined if the denominator is equal to \(0\text{,}\) which occurs exactly when \(x\) is equal to \(4\text{.}\) Therefore the domain is everything else: the domain is \(x\ne 4\text{.}\)
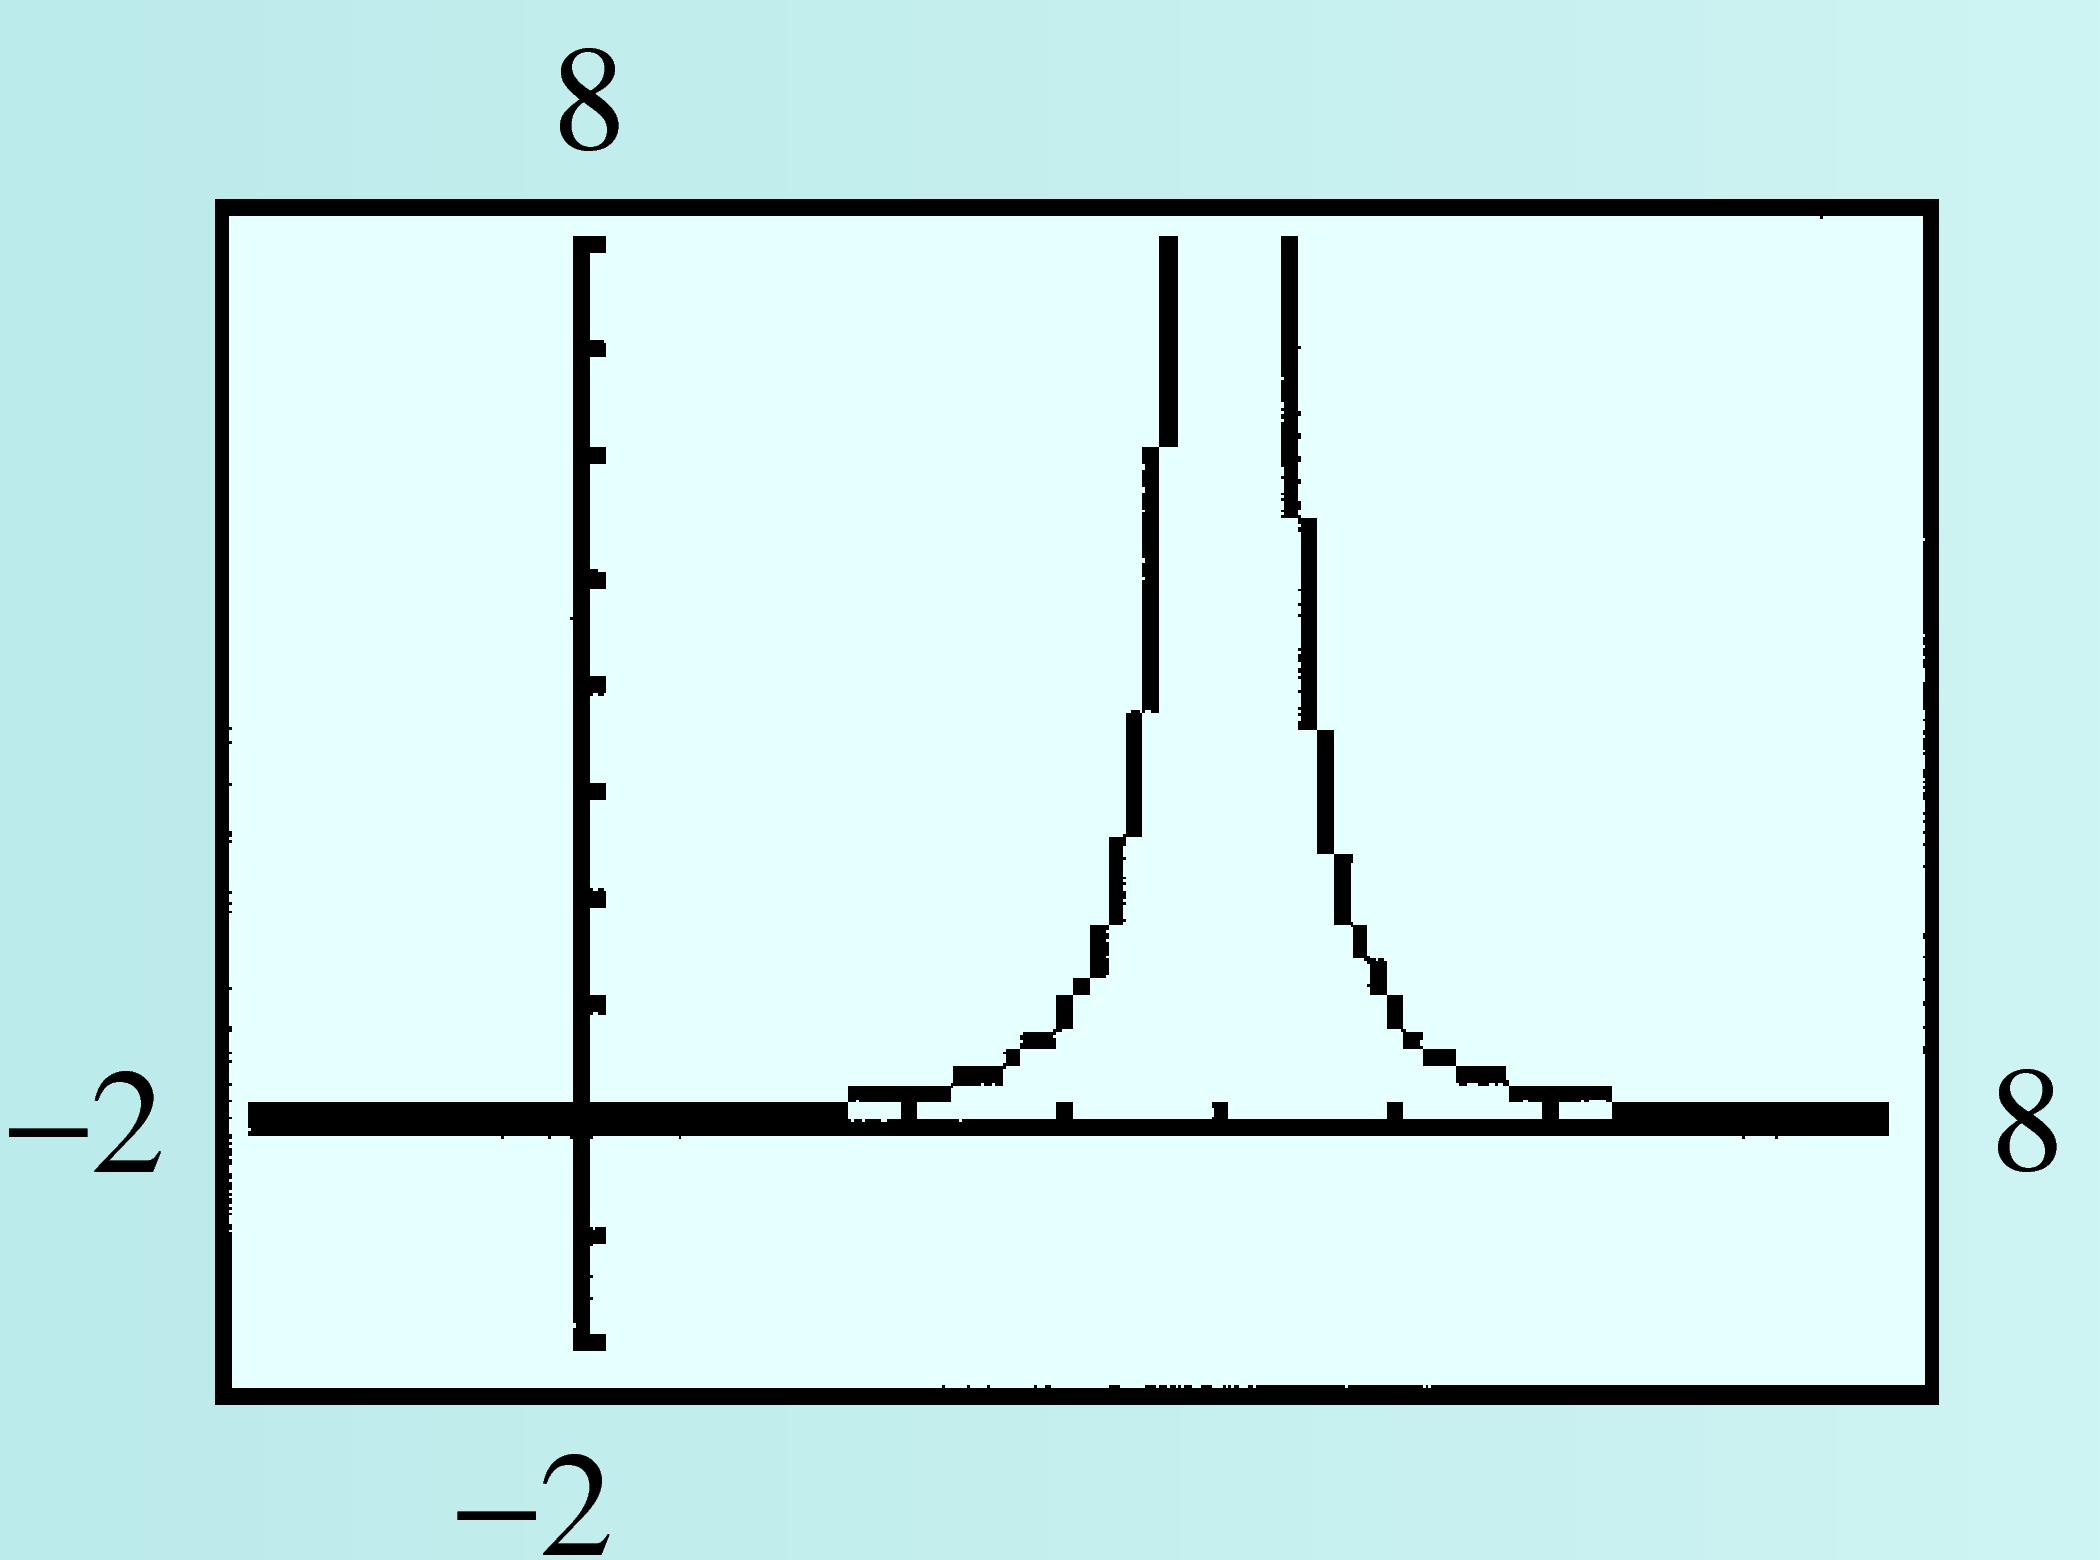
From the graph we see that every value above the \(x\)-axis is in the range, so the range is \(y>0\text{.}\)
For the functions we have studied so far, there are only two operations we must avoid when finding the domain: division by zero and taking the square root of a negative number.
Many common functions have as their domain the entire set of real numbers. In particular, a linear function \(f (x) = b + mx\) can be evaluated at any real number value of \(x\text{,}\) so its domain is the set of all real numbers. This set is represented in interval notation as \((-\infty, \infty)\text{.}\)
The range of the linear function \(f (x) = b + mx\) (if \(m \ne 0\)) is also the set of all real numbers, because the graph continues infinitely at both ends. (See Figure71a.) If \(m = 0\text{,}\) then \(f (x) = b\text{,}\) and the graph of \(f\) is a horizontal line. In this case, the range consists of a single number, \(b\text{.}\)

In many applications, we may restrict the domain of a function to suit the situation at hand.
The function \(h = f (t) = 1454 - 16t^2\) gives the height of an algebra book dropped from the top of the Sears Tower as a function of time. Give a suitable domain for this application, and the corresponding range.
You can use the window \begin{align} \text{Xmin} \amp = -10 \amp\amp \text{Xmax} = 10\\ \text{Ymin} \amp = -100 \amp\amp \text{Ymax} = 1500 \end{align} to obtain the graph shown in Figure73.

Because \(t\) represents the time in seconds after the book was dropped, only positive \(t\)-values make sense for the problem. The book stops falling when it hits the ground, at \(h = 0\text{.}\) You can verify that this happens at approximately \(t = 9.5\) seconds. Thus, only \(t\)-values between \(0\) and \(9.5\) are realistic for this application, so we restrict the domain of the function \(f\) to the interval \([0, 9.5]\text{.}\)
During that time period, the height, \(h\text{,}\) of the book decreases from \(1454\) feet to \(0\) feet. The range of the function on the domain \([0, 9.5]\) is \([0, 1454]\text{.}\) The graph is shown in Figure74.

The children in Francine's art class are going to make cardboard boxes. Each child is given a sheet of cardboard that measures 18 inches by 24 inches. To make a box, the child will cut out a square from each corner and turn up the edges, as shown in Figure76.

The height of the box is \(x\text{;}\) the width of the box is \(24-2x\text{;}\) and the length of the box is \(18-2x\text{.}\) Therefore the volume of the box can be given by \(V = f (x) = x(24 - 2x)(18 - 2x)\)
To find the domain, we need to ask ourselves what values of \(x\) make sense within the context of this problem. The children have to cut corners out, so \(x\) must be greater than \(0\text{.}\) If \(x\) is \(9\) or bigger, than the corners that are cut out will overlap, so \(x\) must be less than \(9\text{.}\) Therefore the domain is \((0,9) \)
The range of \(V\) on the domain \((0, 9)\) is \((0, 655)\)
