Chapter2Linear Equations and Modeling
In this chapter, we'll discuss the most basic form an equation can be, a linear equation. Many of the ideas you learn about linear equations like inputs, outputs, slope, intercepts, etc. are all qualities that other equations have in one way, shape, or form. Therefore, learning these things for linear equations means you'll easily be able to learn them for more complicated equations!
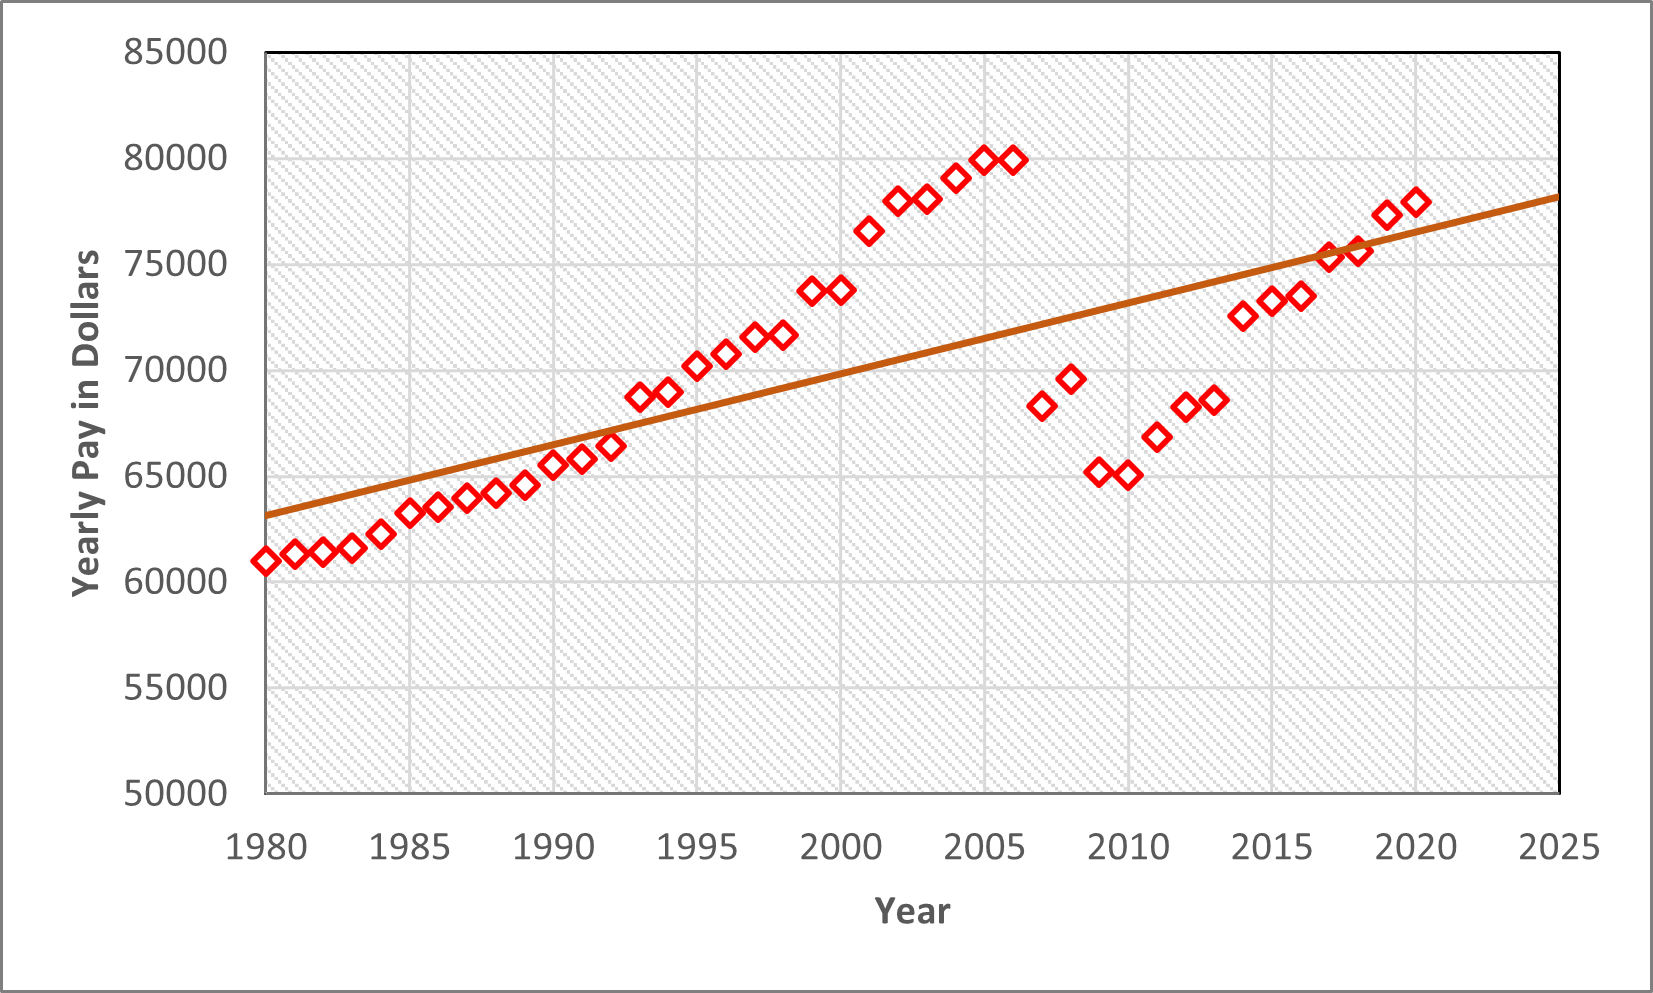
One application of linear equations in the professional world is in linear regression models for finance, business, and statistics. Suppose we have data like the average annual pay for a certain job from the years 1980 to 2020. We can visualize this data on a graph where the horizontal axis is years and the vertical axis is dollars for the pay. See the figure below.
What linear regression provides us is a line that draws the trend of the data. Therefore, we can make educated estimates on how much this particular job will make in the next year or 10 years down that line. The slope and other properties about this line can also be useful information, and so it's important to know what these properties are and this chapter will be the introduction!