
Supplemental Videos
The main topics of this section are also presented in the following videos:
The main topics of this section are also presented in the following videos:
We often want to predict values of one variable from the values of a related variable. For example, when a physician prescribes a drug in a certain dosage, she needs to know how long the dose will remain in the bloodstream. A sales manager needs to know how the price of his product will affect its sales. A function is a special type of relationship between variables that allows us to make such predictions.
Suppose it costs $800 for flying lessons, plus $130 per hour to rent a plane. If we let \(C\) represent the total cost for \(t\) hours of flying lessons, then
Thus, for example
| when | \(t=\alert{0}\text{,}\) | \(C=800+130(\alert{0})=800\) |
| when | \(t=\alert{4}\text{,}\) | \(C=800+130(\alert{4})=1320\) |
| when | \(t=\alert{10}\text{,}\) | \(C=800+130(\alert{10})=2100\) |
The variable \(t\) is called the input or independent variable, and \(C\) is the output or dependent variable, because its values are determined by the value of \(t\text{.}\) We can display the relationship between two variables by a table or by ordered pairs. The input variable is the first component of the ordered pair, and the output variable is the second component.
| \(t\) | \(C\) | \((t,C)\) |
| \(0\) | \(800\) | \((0, 800)\) |
| \(4\) | \(1320\) | \((4, 1320)\) |
| \(10\) | \(2100\) | \((10,2100)\) |
For this relationship, we can find the value of \(C\) for any given value of \(t\text{.}\) All we have to do is substitute the value of \(t\) into the equation and solve for \(C\text{.}\) Note that there can be only one value of \(C\) for each value of \(t\text{.}\)
A function is a relationship between two variables for which a unique value of the output variable can be determined from a value of the input variable. In other words, a function is relation in which every input corresponds to exactly one output.
What distinguishes functions from other variable relationships? The definition of a function calls for a unique value that is, exactly one value of the output variable corresponding to each value of the input variable. This property makes functions useful in applications because they can often be used to make predictions.
The distance, \(d\text{,}\) traveled by a car in 2 hours is a function of its speed, \(r\text{.}\) If we know the speed of the car, we can determine the distance it travels by the formula \(d = r \cdot 2\text{.}\)
The cost of a fill-up with unleaded gasoline is a function of the number of gallons purchased. The gas pump represents the function by displaying the corresponding values of the input variable (number of gallons) and the output variable (cost).
Score on the Scholastic Aptitude Test (SAT) is not a function of score on an IQ test, because two people with the same score on an IQ test may score differently on the SAT; that is, a person's score on the SAT is not uniquely determined by his or her score on an IQ test.
As part of a project to improve the success rate of freshmen, the counseling department studied the grades earned by a group of students in English and algebra. Do you think that a student's grade in algebra is a function of his or her grade in English? Explain why or why not.
Phatburger features a soda bar, where you can serve your own soft drinks in any size. Do you think that the number of calories in a serving of Zap Kola is a function of the number of fluid ounces? Explain why or why not.
A function can be described in several different ways. In the following examples, we consider functions defined by tables, by graphs, and by equations.
When we use a table to describe a function, unless stated otherwise the first variable in the table (the left column of a vertical table or the top row of a horizontal table) is the input variable, and the second variable is the output. We say that the output variable is a function of the input.
Table4 shows data on sales compiled over several years by the accounting office for Eau Claire Auto Parts, a division of Major Motors. In this example, the year is the input variable, and total sales is the output. We can see that it is a function since each input (year) corresponds to exactly one output (total sales). We say that total sales is a function of the year, or \(S\text{,}\) is a function of \(t\text{.}\)
| Year \((t)\) | Total sales \((S)\) |
| 2000 | $612,000 |
| 2001 | $663,000 |
| 2002 | $692,000 |
| 2003 | $749,000 |
| 2004 | $904,000 |
Table5 gives the cost of sending printed material by first-class mail in 2016.
| Weight in ounces \((w)\) | Postage \((p)\) |
| \(0 \lt w \le 1 \) | $0.47 |
| \(1 \lt w \le 2 \) | $0.68 |
| \(2 \lt w \le 3 \) | $0.89 |
| \(3 \lt w \le 4 \) | $1.10 |
| \(4 \lt w \le 5 \) | $1.31 |
| \(5 \lt w \le 6 \) | $1.52 |
| \(6 \lt w \le 7 \) | $1.73 |
If we know the weight of the article being shipped, we can determine the required postage from Table5. For instance, a catalog weighing 4.5 ounces would require $1.31 in postage. In this example, \(w\) is the input variable and \(p\) is the output variable. We say that \(p\) is a function of \(w\text{.}\)
Table6 records the age and cholesterol count for 20 patients tested in a hospital survey.
| Age | Cholesterol count | Age | Cholesterol count | |
| 53 | 217 | \(\alert{51}\) | \(\alert{209}\) | |
| 48 | 232 | 53 | 241 | |
| 55 | 198 | 49 | 186 | |
| 56 | 238 | \(\alert{51}\) | \(\alert{216}\) | |
| \(\alert{51}\) | \(\alert{227}\) | 57 | 208 | |
| 52 | 264 | 52 | 248 | |
| 53 | 195 | 50 | 214 | |
| 47 | 203 | 56 | 271 | |
| 48 | 212 | 53 | 193 | |
| 50 | 234 | 48 | 172 |
According to these data, cholesterol count is not a function of age, because several patients who are the same age have different cholesterol levels. For example, three different patients are 51 years old but have cholesterol counts of 227, 209, and 216, respectively. This means that the input 51 does not have a unique output and therefore this is not a function. Other factors besides age must influence a person's cholesterol count.
Decide whether each table describes \(y\) as a function of \(x\text{.}\) Explain your choice.
| \(x\) | \(3.5\) | \(2.0\) | \(2.5\) | \(3.5\) | \(2.5\) | \(4.0\) | \(2.5\) | \(3.0\) |
| \(y\) | \(2.5\) | \(3.0\) | \(2.5\) | \(4.0\) | \(3.5\) | \(4.0\) | \(2.0\) | \(2.5\) |
| \(x\) | \(-3\) | \(-2\) | \(-1\) | \(0\) | \(1\) | \(2\) | \(3\) |
| \(y\) | \(17\) | \(3\) | \(0\) | \(-1\) | \(0\) | \(3\) | \(17\) |
This is not a function since there are inputs that do not have a unique output. For example, the input \(x = 3.5\) corresponds both to \(y = 2.5\) and also to \(y = 4.0\text{.}\)
This is a function because each input \(x\) has exactly one value of \(y\) associated with it.
A graph may also be used to define one variable as a function of another. The input variable is displayed on the horizontal axis, and the output variable on the vertical axis.
Figure9 shows the number of hours, \(H\text{,}\) that the sun is above the horizon in Peoria, Illinois, on day \(t\text{,}\) where January 1 corresponds to \(t = 0\text{.}\)
Which variable is the input, and which is the output?
Approximately how many hours of sunlight are there in Peoria on day 150?
On which days are there 12 hours of sunlight?
What are the maximum and minimum values of \(H\text{,}\) and when do these values occur?

The input variable, \(t\text{,}\) appears on the horizontal axis. The number of daylight hours, \(H\text{,}\) is a function of the date. The output variable appears on the vertical axis.
The point on the curve where \(t = 150\) has \(H \approx 14.1\text{,}\) so Peoria gets about 14.1 hours of daylight when \(t = 150\text{,}\) which is at the end of May.
\(H = 12\) at the two points where \(t \approx 85\) (in late March) and \(t \approx 270\) (late September).
The maximum value of 14.4 hours occurs on the longest day of the year, when \(t \approx 170\text{,}\) about three weeks into June. The minimum of 9.6 hours occurs on the shortest day, when \(t \approx 355\text{,}\) about three weeks into December.
Figure11 shows the elevation in feet, \(a\text{,}\) of the Los Angeles Marathon course at a distance \(d\) miles into the race. (Source: Los Angeles Times, March 3, 2005)

Which variable is the input, and which is the output?
What is the elevation at mile 20?
At what distances is the elevation 150 feet?
What are the maximum and minimum values of \(a\text{,}\) and when do these values occur?
The runners pass by the Los Angeles Coliseum at about 4.2 miles into the race. What is the elevation there?
The input variable is \(d\text{,}\) and the output variable is \(a\text{.}\)
Approximately \(210\) feet
Approximately where \(d\approx 5\text{,}\) \(d\approx 11\text{,}\) \(d\approx 12\text{,}\) \(d\approx 16\text{,}\) \(d\approx 17.5\text{,}\) and \(d\approx 18\)
The maximum value of \(300\) feet occurs at the start, when \(d = 0\text{.}\) The minimum of \(85\) feet occurs when \(d\approx 15\text{.}\)
Approximately \(165\) feet
Example12 illustrates a function defined by an equation.
As of 2016, One World Trade Center in New York City is the nation's tallest building, at 1776 feet. If an algebra book is dropped from the top of One World Trade Center, its height above the ground after \(t\) seconds is given by the equation
Thus, after \(\alert{1}\) second the book's height is
After \(\alert{2}\) seconds its height is
For this function, \(t\) is the input variable and \(h\) is the output variable. For any value of \(t\text{,}\) a unique value of \(h\) can be determined from the equation for \(h\text{.}\) We say that \(h\) is a function of \(t\text{.}\)
Write an equation that gives the area, \(A\text{,}\) of a circle as a function of its radius, \(r\text{.}\)
\(A = \pi r^2\)
We can use a graphing calculator or other software to make a table of values for a function defined by an equation.
We will proceed to demonstrate how this is done on a TI-84 Plus graphing calculator. However, you could easily perform these calculations using any spreadsheet software or Desmos. For more information on using Desmos to complete such a table please visit https://support.desmos.com/hc/en-us/articles/202529239-Function-Tables For the function in Example12,
we begin by entering the equation: Press the Y= key, clear out any other equations, and define \(Y_1 = 1776 - 16X^2.\)
Next, we choose the \(x\)-values for the table. Press 2ndWINDOW to access the TblSet (Table Setup) menu and set it to look like Figure15. This setting will give us an initial x-value of 0 \((TblStart = 0)\) and an increment of one unit in the \(x\)-values, \((\Delta Tbl = 1)\text{.}\) It also fills in values of both variables automatically. Now press 2nd GRAPH to see the table of values, as shown in Figure16. From this table, we can check the heights we found in Example12.
Now try making a table of values with \(TblStart = 0\) and \(\Delta Tbl = 0.5\text{.}\) Use the \(\boxed{\uparrow}\) and \(\boxed{\downarrow}\) arrow keys to scroll up and down the table.


There is a convenient notation for discussing functions. First, we choose a letter, such as \(f\text{,}\) \(g\text{,}\) or \(h\) (or \(F\text{,}\) \(G\text{,}\) or \(H\)), to name a particular function. (We can use any letter, but these are the most common choices.) For instance, in Example12, the height, \(h\text{,}\) of a falling algebra book is a function of the elapsed time, \(t\text{.}\) We might call this function \(f\text{.}\) In other words, \(f\) is the name of the relationship between the variables \(h\) and \(t\text{.}\) We write
which means "\(h\) is a function of \(t\text{,}\) and \(f\) is the name of the function."
The new symbol \(f(t)\text{,}\) read "\(f\) of \(t\text{,}\)" is another name for the height, \(h\text{.}\) The parentheses in the symbol \(f(t)\) do not indicate multiplication. (It would not make sense to multiply the name of a function by a variable.) Think of the symbol \(f(t)\) as a single variable that represents the output value of the function.
With this new notation we may write
or just
instead of
to describe the function.
Perhaps it seems complicated to introduce a new symbol for \(h\text{,}\) but the notation \(f(t)\) is very useful for showing the correspondence between specific values of the variables \(h\) and \(t\text{.}\)
In Example12, the height of an algebra book dropped from the top of One World Trade Center (New York's tallest buiilding in 2016) is given by the equation
We see that
| when \(t=1\) | \(h=1760\) | |
| when \(t=2\) | \(h=1712\) |
Using function notation, these relationships can be expressed more concisely as
| \(f(1)=1760\) | and | \(f(2)=1712\) |
which we read as "\(f\) of 1 equals 1760" and "\(f\) of 2 equals 1712." The values for the input variable, \(t\text{,}\) appear inside the parentheses, and the values for the output variable, \(h\text{,}\) appear on the other side of the equation.
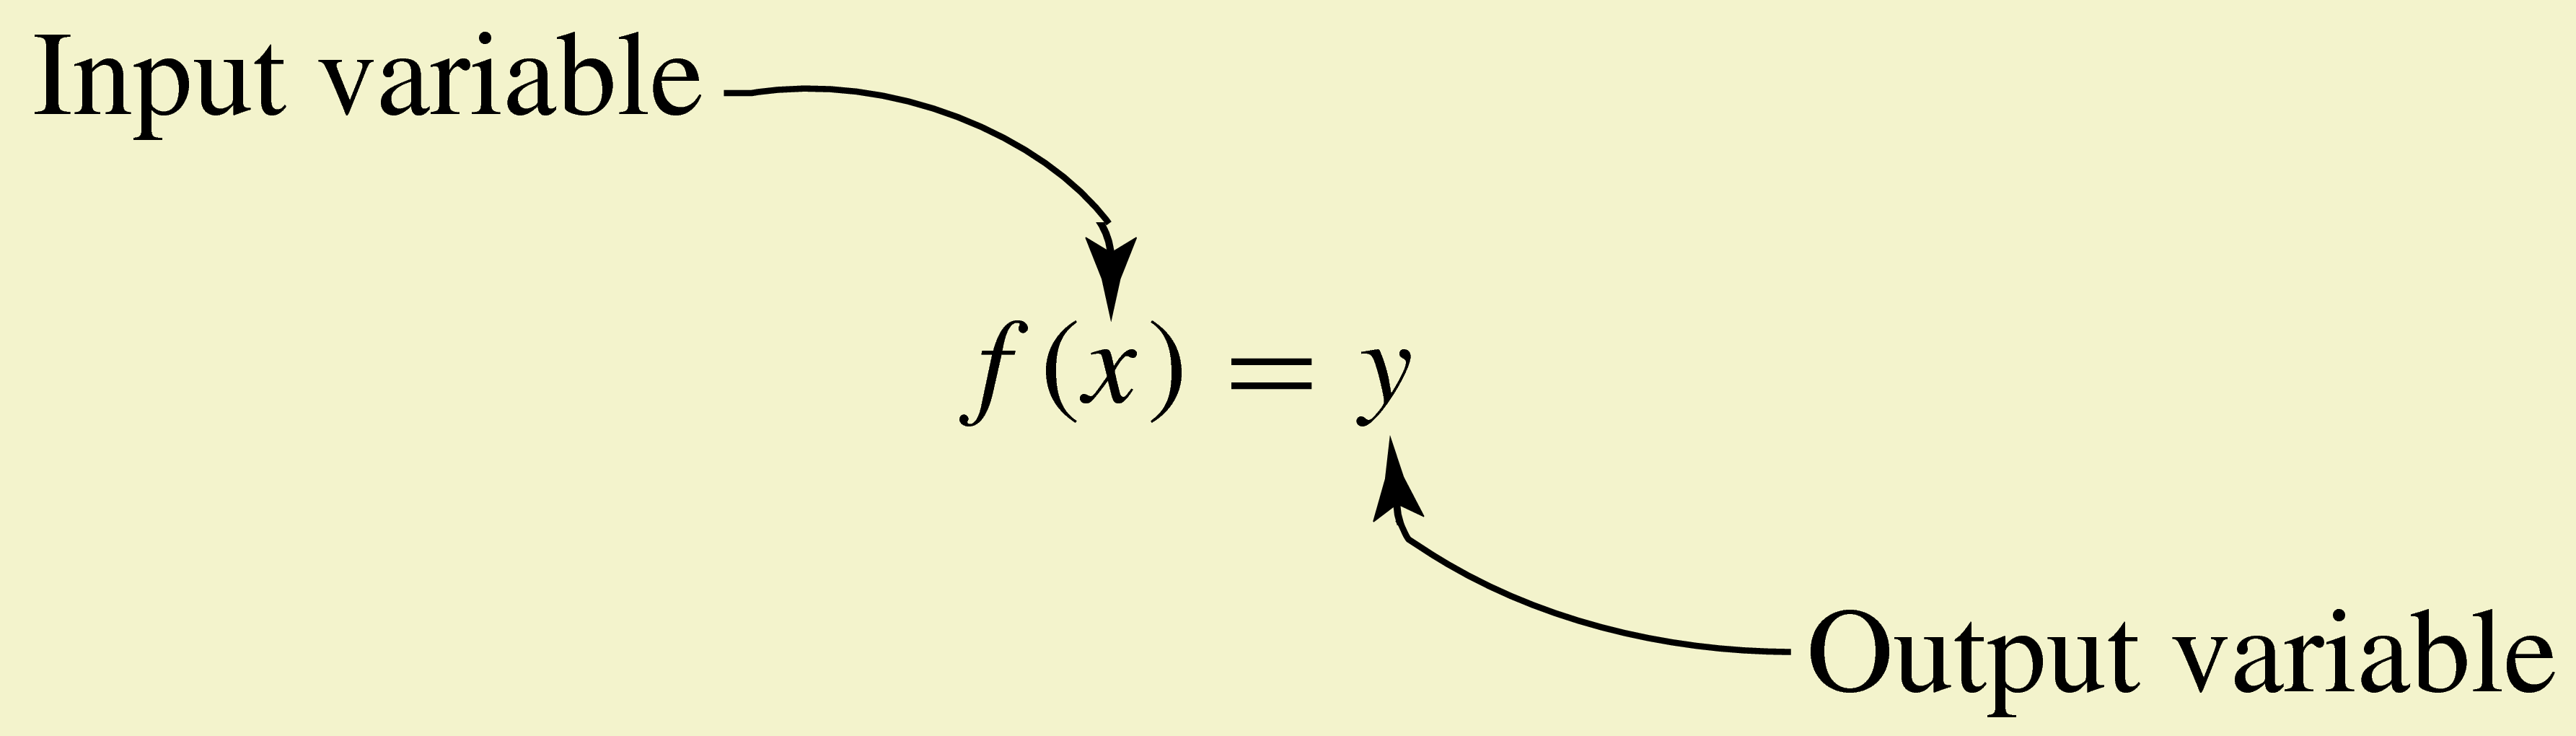
Remember that when we write \(y = f(x)\text{,}\) the symbol \(f(x)\) is just another name for the output variable.
Let \(F\) be the name of the function defined by the graph in Example8, the number of hours of daylight in Peoria.
Use function notation to state that \(H\) is a function of \(t\text{.}\)
What does the statement \(F(15) = 9.7\) mean in the context of the problem?
\(H = F(t)\)
The sun is above the horizon in Peoria for \(9.7\) hours on January 16.
Finding the value of the output variable that corresponds to a particular value of the input variable is called evaluating the function.
Let \(g\) be the name of the postage function defined by Table5 in Example3. Find \(g(1)\text{,}\) \(g(3)\text{,}\) and \(g(6.75\)).
According to the table,
| when \(w=1\text{,}\) | \(p=0.47\) | so | \(g(1)=0.47\) | |
| when \(w=3\text{,}\) | \(p=0.89\) | so | \(g(3)=0.89\) | |
| when \(w=6.75\text{,}\) | \(p=1.73\) | so | \(g(6.75)=1.73\) |
When you exercise, your heart rate should increase until it reaches your target heart rate. The table shows target heart rate, \(r = f(a)\text{,}\) as a function of age.
| \(a\) | \(20\) | \(25\) | \(30\) | \(35\) | \(40\) | \(45\) | \(50\) | \(55\) | \(60\) | \(65\) | \(70\) |
| \(r\) | \(150\) | \(146\) | \(142\) | \(139\) | \(135\) | \(131\) | \(127\) | \(124\) | \(120\) | \(116\) | \(112\) |
Find \(f(25)\) and \(f(50)\text{.}\)
Find a value of \(a\) for which \(f(a) = 135\text{.}\)
\(f (25) = 146, ~~f (50) = 127\)
\(a = 40\)
If a function is described by an equation, we simply substitute the given input value into the equation to find the corresponding output, or function value.
The function \(f\) is defined by \(f(s) = \dfrac{\sqrt{s+3}}{s}\text{.}\) Evaluate the function at the following values.
\(s=6\)
\(s=-1\)
\(f(\alert{6})=\dfrac{\sqrt{\alert{6}+3}}{\alert{6}}= \dfrac{\sqrt{9}}{6}=\dfrac{3}{6}=\dfrac{1}{2}\text{.}\) Thus, \(f(6)=\dfrac{1}{2}\text{.}\)
\(f(\alert{-1})=\dfrac{\sqrt{\alert{-1}+3}}{\alert{-1}}= \dfrac{\sqrt{2}}{-1}=-\sqrt{2}\text{.}\) Thus, \(f(-1)=-\sqrt{2}\text{.}\)
Complete the table displaying ordered pairs for the function \(f(x) = 5 - x^3\text{.}\) Evaluate the function to find the corresponding \(f(x)\)-value for each value of \(x\text{.}\)
| \(x\) | \(f(x)\) | |
| \(-2\) | \(\) | \(f(\alert{-2})=5-(\alert{-2})^3=~\) |
| \(0\) | \(\) | \(f(\alert{0})=5-\alert{0}^3=\) |
| \(1\) | \(\) | \(f(\alert{1})=5-\alert{1}^3=\) |
| \(3\) | \(\) | \(f(\alert{3})=5-\alert{3}^3=\) |
| \(x\) | \(f(x)\) |
| \(-2\) | \(\alert{13} \) |
| \(0\) | \(\alert{5}\) |
| \(1\) | \(\alert{4}\) |
| \(3\) | \(\alert{-22}\) |
We can use the table feature on a graphing calculator to evaluate functions. Consider the function of Example23, \(f(x) = 5 - x^3\text{.}\)
Press Y=, clear any old functions, and enter
\(\qquad Y_1=5-X\) ^ \(3\)
Then press TblSet (2nd WINDOW) and choose Ask after Indpnt, as shown in Figure25, and press ENTER. This setting allows you to enter any \(x\)-values you like. Next, press TABLE (using 2nd GRAPH).
To follow Example23, key in (-) 2 ENTER for the \(x\)-value, and the calculator will fill in the \(y\)-value. Continue by entering 0, 1, 3, or any other \(x\)-values you choose. One such table is shown in Figure26.
If you would like to evaluate a new function, you do not have to return to the Y= screen. Use the \(\boxed{\rightarrow}\) and \(\boxed{\uparrow}\) arrow keys to highlight \(Y_1\) at the top of the second column. The definition of \(Y_1\) will appear at the bottom of the display, as shown in Figure26. You can key in a new definition here, and the second column will be updated automatically to show the \(y\)-values of the new function.


To simplify the notation, we sometimes use the same letter for the output variable and for the name of the function. In the next example, \(C\) is used in this way.
TrailGear decides to market a line of backpacks. The cost, \(C\text{,}\) of manufacturing backpacks is a function of the number, \(x\text{,}\) of backpacks produced, given by the equation
where \(C(x)\) is measured in dollars. Find the cost of producing 500 backpacks.
To find the value of \(C\) that corresponds to \(x = \alert{500}\text{,}\) evaluate \(C(500)\text{.}\)
The cost of producing 500 backpacks is $13,000.
The volume of a sphere of radius \(r\) centimeters is given by
Evaluate \(V(10)\) and explain what it means.
\(V(10) = 4000\pi/3\approx 4188.79 \text{ cm}^3\) is the volume of a sphere whose radius is \(10\) cm.
Before completing this section we turn again to the definition of a function in order to develop one very powerful tool for deciding if a relation is a function. Recall the definition of a function.
A function is a relationship between two variables for which a unique value of the output variable can be determined from a value of the input variable. In other words, a function is relation in which every input corresponds to exactly one output.
One way of thinking about this definition is that in a function, two different outputs cannot be related to the same input. This restriction means that two different ordered pairs cannot have the same first coordinate. What does it mean for the graph of the function?
Consider the graph shown in Figure29a. Every vertical line intersects the graph in at most one point, so there is only one point on the graph for each \(x\)-value. This graph represents a function. In Figure29b, however, the line \(x = 2\) intersects the graph at two points, \((2, 1)\) and \((2, 4)\text{.}\) Two different \(y\)-values, \(1\) and \(4\text{,}\) are related to the same \(x\)-value, \(2\text{.}\) This graph cannot be the graph of a function.

We summarize these observations as follows.
A graph represents a function if and only if every vertical line intersects the graph in at most one point.
The following figure demonstrates how the vertical line test works. Try changing the equation (to anything with variables \(x\) and \(y\)) and dragging the vertical line around to determine whether your equation passes the vertical line test.
Use the vertical line test to decide which of the graphs in Figure32 represent functions.

Graph (a) represents a function, because it passes the vertical line test.
Graph (b) is not the graph of a function, because the vertical line at (for example) \(x = 1\) intersects the graph at two points.
For graph (c), notice the break in the curve at \(x = 2\text{:}\) The solid dot at \((2, 1)\) is the only point on the graph with \(x = 2\text{;}\) the open circle at \((2, 3)\) indicates that \((2, 3)\) is not a point on the graph. Thus, graph (c) is a function, with \(f(2) = 1\text{.}\)
Use the vertical line test to determine which of the graphs in Figure34 represent functions.

Only (b) is a function.