Supplemental Videos
The main topics of this section are also presented in the following videos:
The main topics of this section are also presented in the following videos:
The London Eye is a huge Ferris wheel located on the South Bank of the River Thames in London, England. It is 135 meters (443 feet) tall and completes one full rotation every 30 minutes. If we look at the behavior of one of the wheel's passenger capsules, we see that it completes one cycle, or one revolution, and then repeats this revolution over and over again.
The motion of this Ferris wheel is an example of a periodic function because its revolution or cycle is repeated every 30 minutes, and so we say that it has a period of 30 minutes.
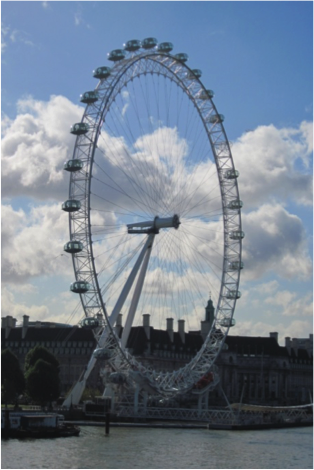
In this section, we use the rotation of the London Eye as an example of a periodic function and will work to sketch a graph of a rider's height above ground over time.
A periodic function is a function whose output values repeat on a regular interval. In mathematical terms, we say that a periodic function is a function for which a specific horizontal shift, \(P\text{,}\) results in the original function: \(f(x+P)=f(x)\) for all values of \(x\text{.}\)
The period of a periodic function is how long it takes for the output values to begin repeating, or the smallest horizontal shift with \(P>0\text{,}\) such that \(f(x+P)=f(x)\) for all values of \(x\text{.}\)
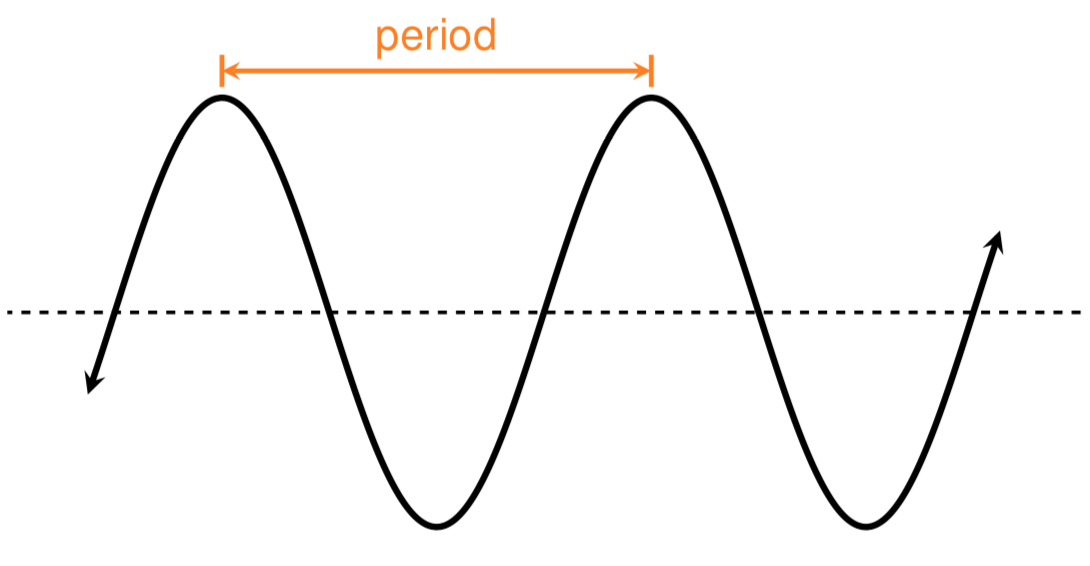
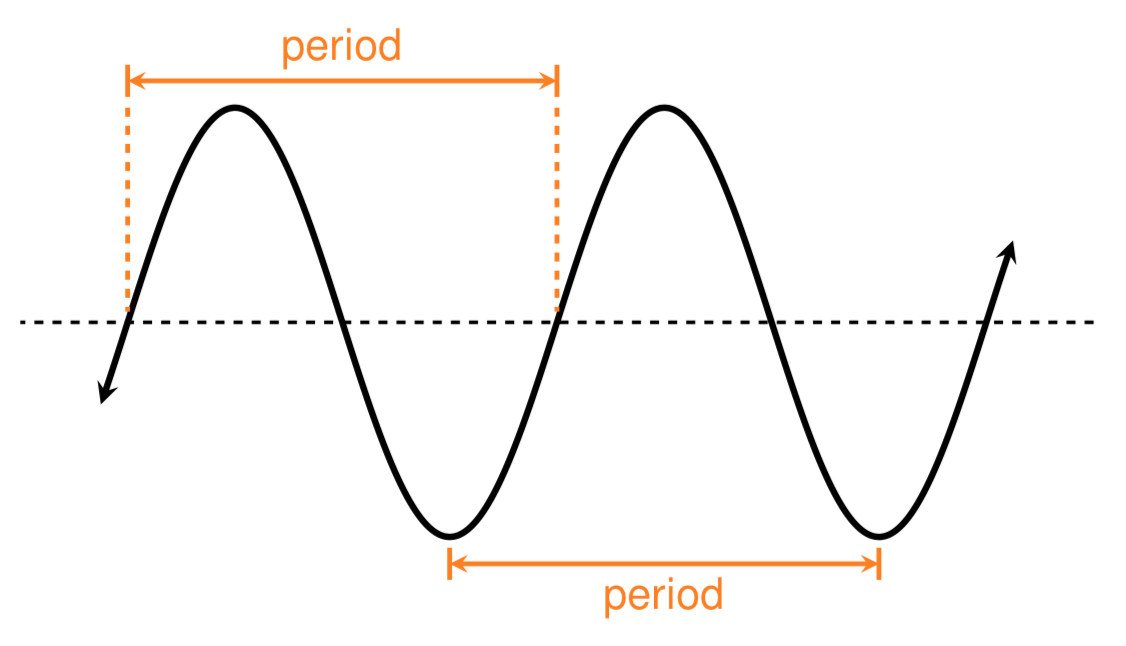
In the figure above, we show the period as the interval from one maximum value to the next maximum value. We could just as easily have shown the period as the interval between minimum values or between any two points on the graph where the output values begin to repeat, as shown in the figure below.
The London Eye is a huge Ferris wheel in London, England. It completes one full rotation every 30 minutes, and the diameter of its passenger capsules is 130 meters. Riders board the passenger capsules from a platform that is 5 meters above the ground. At time \(t=0\text{,}\) an individual boards the Ferris wheel.
Sketch a graph of \(h=f(t)\text{,}\) where \(h\) is the height of the individual above ground (in meters) after \(t\) minutes.
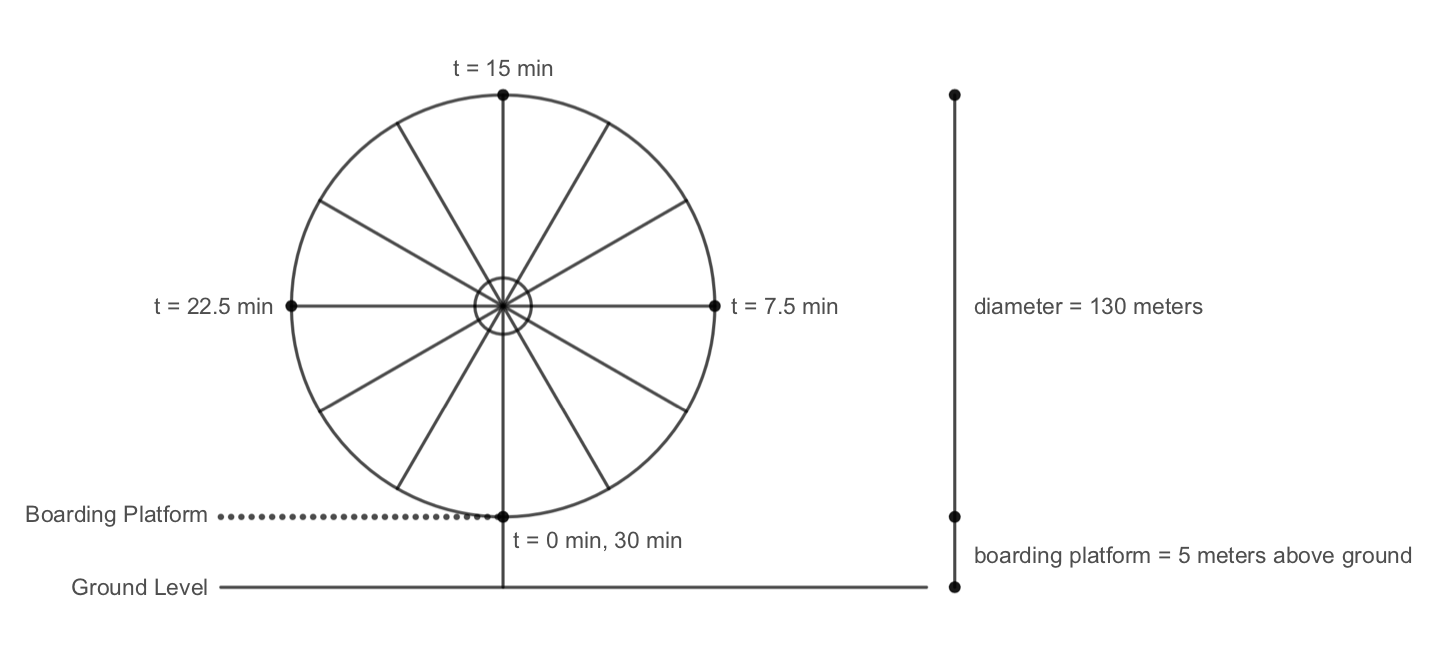
Let's start by drawing a picture of the Ferris wheel and labeling the known information.
We know that at time \(t=0\) a rider boards the Ferris wheel from the boarding platform, which is 5 meters above the ground. We also know that the Ferris wheel has a diameter of 130 meters and it takes 30 minutes to complete one full revolution around the Ferris wheel.
Since it takes 30 minutes to complete a trip around the Ferris wheel, a rider will reach the top of the Ferris wheel after 15 minutes (assuming that the wheel rotates at a constant speed). Similarly, the rider will reach the three o'clock and nine o'clock positions on the Ferris wheel at 7.5 minutes and 22.5 minutes.
Next, we can make a table of the rider's height above ground vs. time.
At time \(t=0\text{,}\) the rider is at the boarding platform, which corresponds to a height of 5 meters above ground. After 15 minutes, the rider reaches the top of the Ferris wheel, which corresponds to a height of 135 meters above ground. We can find this height by taking the height of the boarding platform plus the diameter of the Ferris wheel.
We can also find an intermediate height corresponding to when the rider has been on the Ferris wheel for 7.5 minutes and 22.5 minutes. At these two positions, the rider is halfway between the top of the Ferris wheel and the boarding platform. We can find this height by adding the height of the boarding platform to the radius of the Ferris wheel. Therefore, we get a height of \(5+65 = 70\) meters above ground at these two times.
After 30 minutes, the rider is back at the boarding platform, which corresponds to a height of 5 meters above ground. If the individual were to continue riding the Ferris wheel, this pattern of heights would continue and we could extend our table with additional times and heights as shown below.
| time, \(t\) (minutes) | 0 | 7.5 | 15 | 22.5 | 30 | 37.5 | 45 |
| height, \(h=f(t)\) (meters) | 5 | 70 | 135 | 70 | 5 | 70 | 135 |
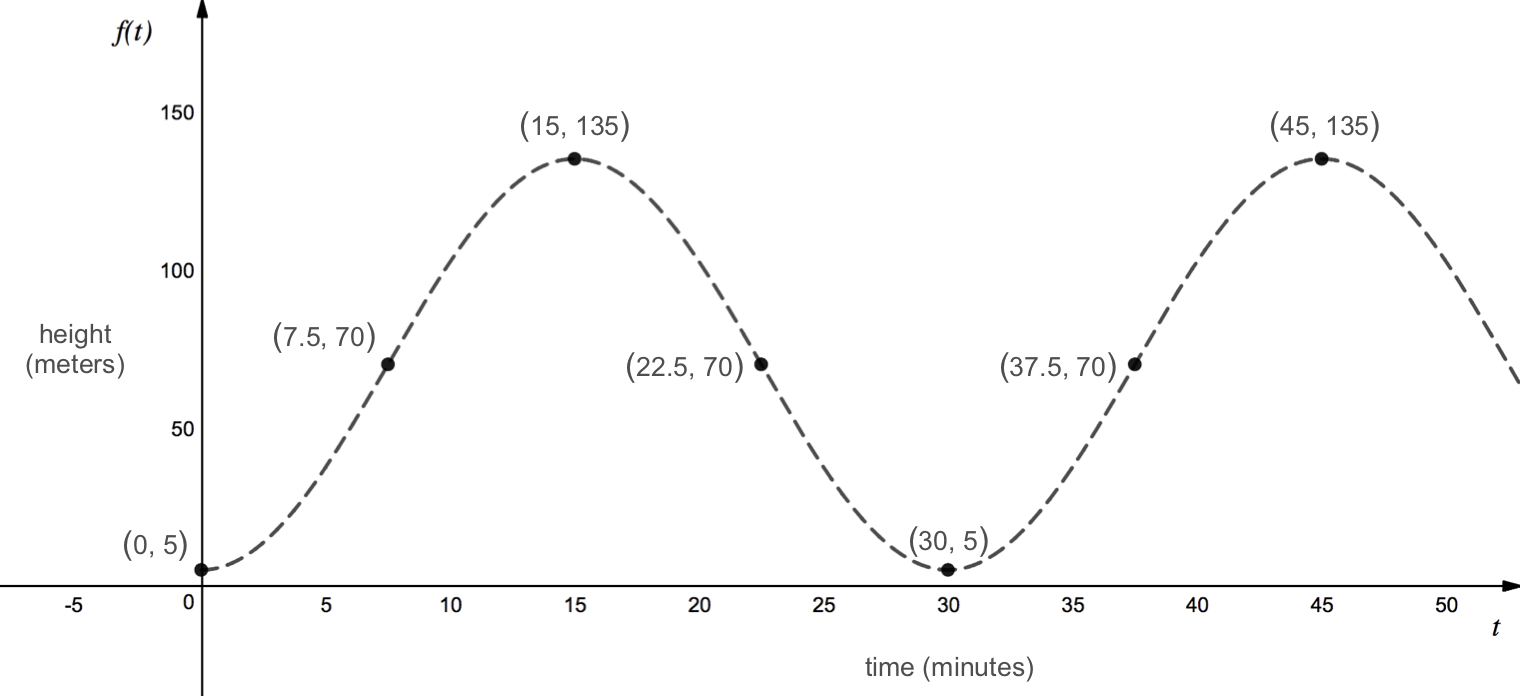
Now that we have a table of times and corresponding heights, we can plot these points and draw a smooth curve between them to create a height vs. time graph.
Since we are graphing height as a function of time, time is our independent variable and should be plotted along the horizontal axis while height is the dependent variable and should be plotted along the vertical axis.
Note that in this example, we assumed that the Ferris wheel was rotating counterclockwise, as shown in our sketch above. For this problem, it did not matter what direction the Ferris wheel was rotating because both clockwise and counterclockwise rotation would have produced the same height vs. time graph. However, this will not always be the case. If the rider were to start in the three o'clock or nine o'clock position, we would need to know whether the Ferris wheel was turning clockwise or counterclockwise in order to sketch a graph of the rider's height above ground.
In the previous example, we sketched a graph of a periodic function representing the height of a passenger on the London Eye over time. By looking at our graph, we can see that the periodic function we sketched has both a maximum value and a minimum value. We can use these maximum and minimum values to define special properties of periodic functions.
The midline of a periodic function is the horizontal line halfway, or midway, between the function's maximum and minimum output values.
The amplitude of a periodic function is the distance between the function's maximum (or minimum) output value and the midline.
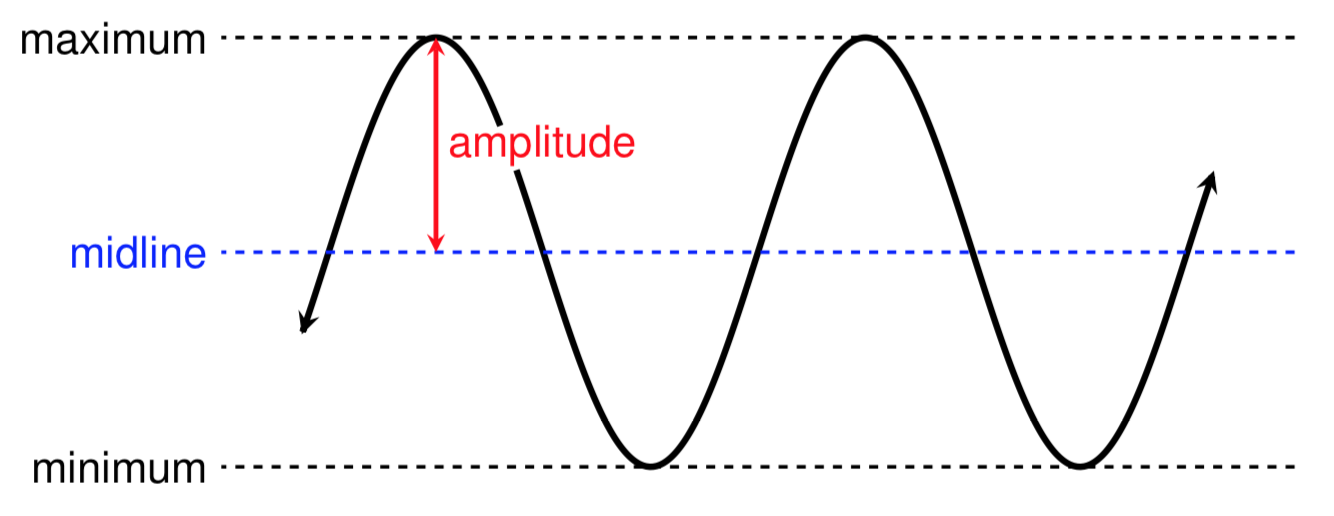
The midline often represents the average value of a wave-like periodic function and should always be written as the equation of a horizontal line (this means that the midline will look like \(y=a\) for some constant \(a\text{,}\) as opposed to just the number \(a\)). The amplitude of a periodic function represents how "large" the function's oscillations are.
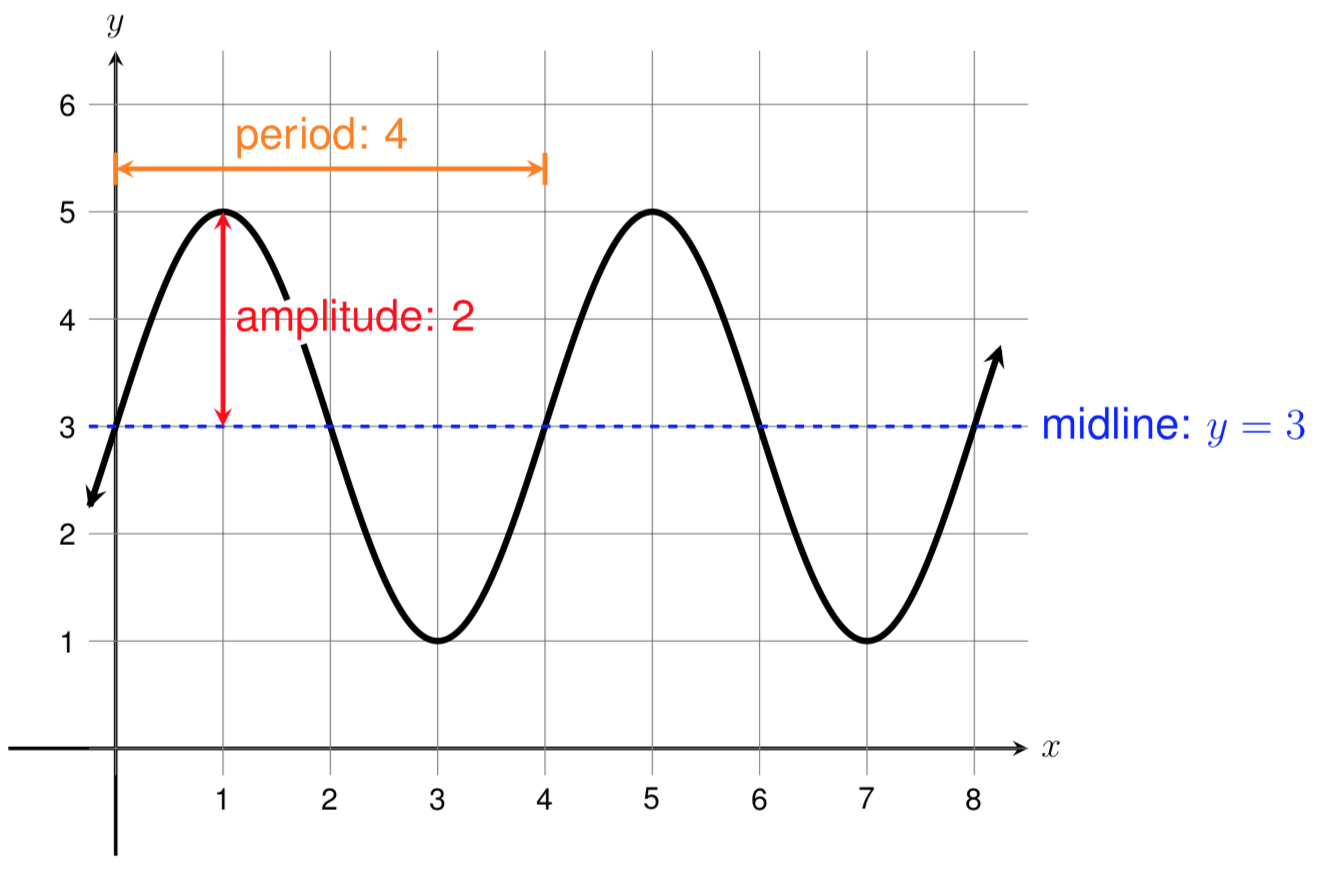
Find the period, midline, and amplitude of the function shown below.
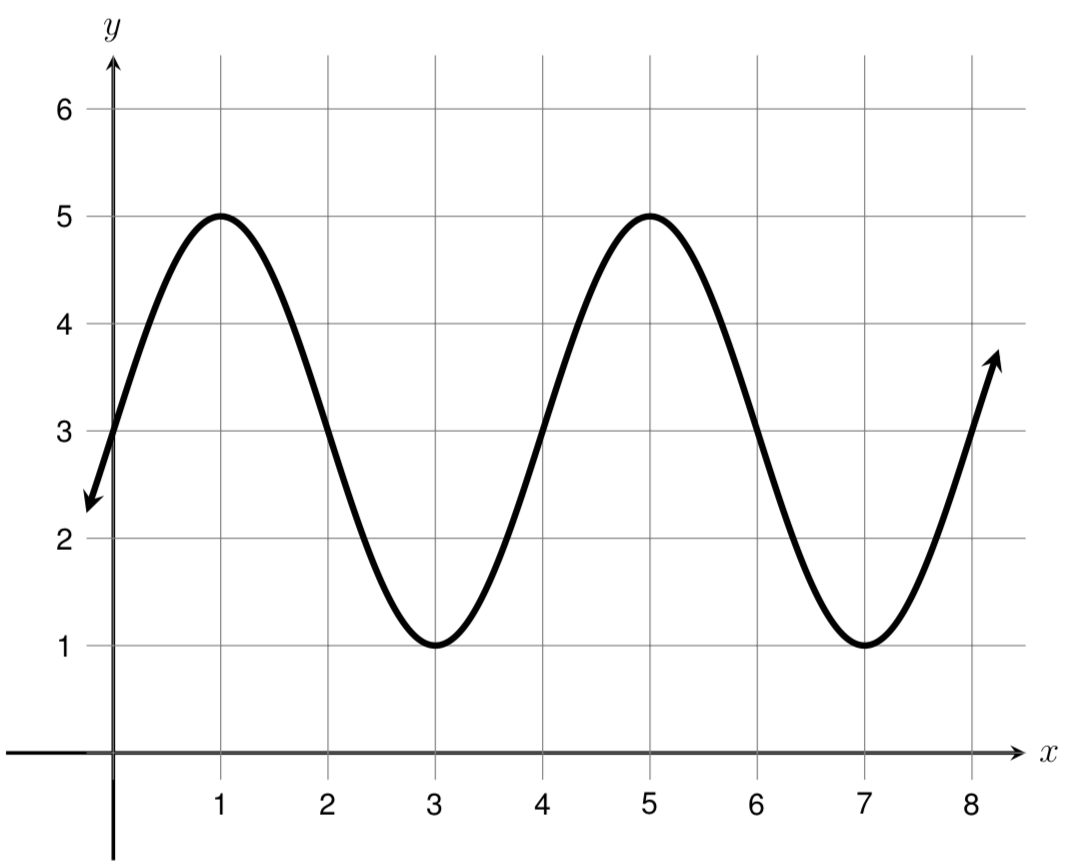
By definition, the period of the function is how long it takes for the function to start repeating. If we think about the function "starting" at \(x=0\text{,}\) or when it crosses the \(y\)-axis, we can see that it begins repeating when \(x=4\text{.}\) Therefore, the period of the function is 4.
The midline of the function is the horizontal line halfway between the function's maximum and minimum values. Here, the maximum value of the function is 5 and the minimum value is 1. To find the number halfway between 5 and 1, we can take the average of the two numbers. The average of 5 and 1 is
Thus, the midline of the function is the line \(y=3\text{.}\)
The amplitude of the function is the distance between the function's maximum value and the midline. We can find this value by subtracting the midline from the maximum value. Therefore, the amplitude of this function is \(5 - 3 = 2\text{.}\)
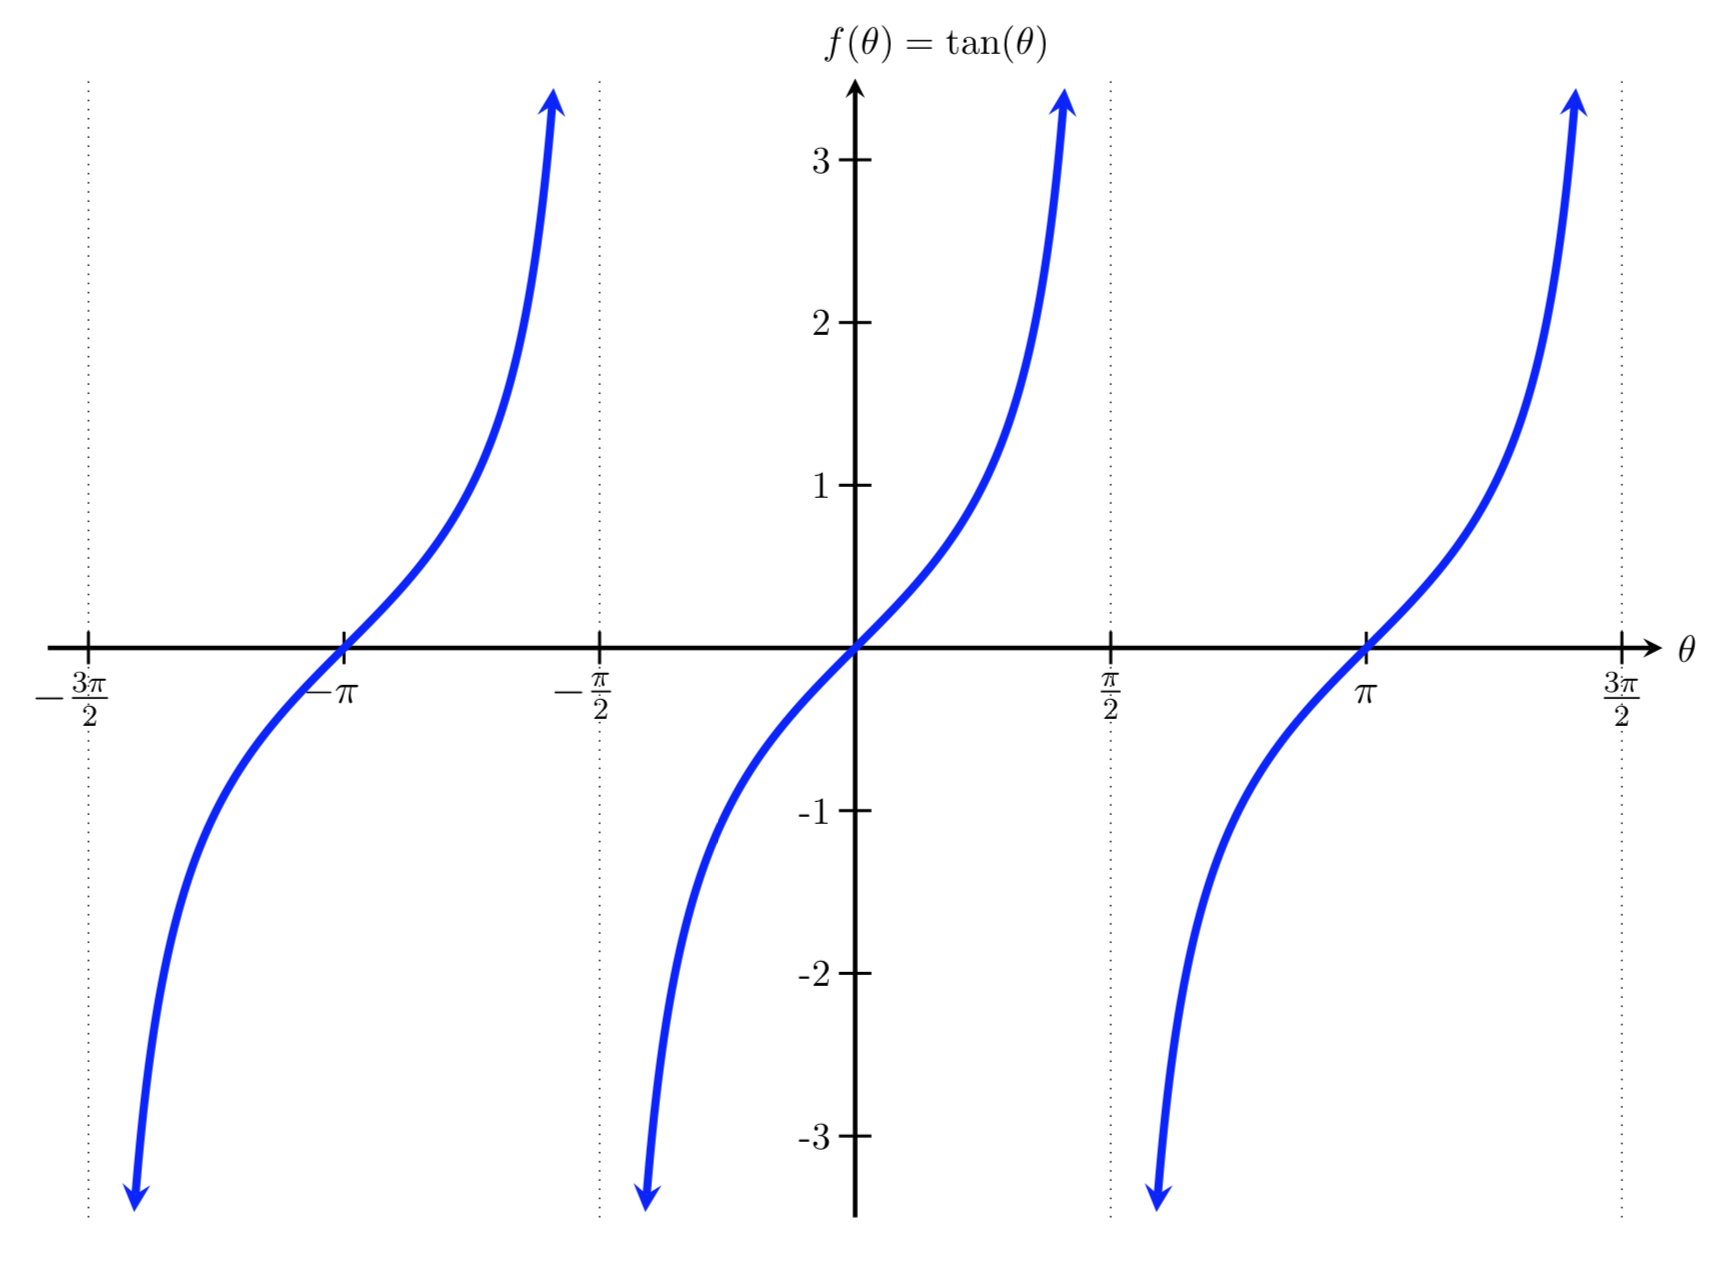
Not all periodic functions have a midline or amplitude. Shown below is an example of a periodic function that does not have a minimum or maximum value. Since there are no minimum or maximum values, we cannot find a midline or an amplitude for this periodic function.
However, all periodic functions must have a period. If a function does not have a period, then it cannot be a periodic function!