Section 5.2 Vertical and Horizontal Shifts

In this section, we explore how certain changes in the formula for a function affect its graph. In particular, we will compare the graph of \(y = f (x)\) with the graphs of
\begin{equation*} y = f (x) + k,~~~ \text{ and }~~~ y =f (x + h) \end{equation*}
for different values of the constants \(k\) and \(h\text{.}\) Such variations are called transformations of the graph.

Subsection 5.2.1 Vertical Shifts

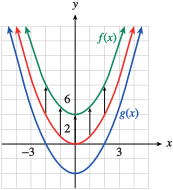
Figure 5.5 shows the graphs of \(f (x) = x^2 + 4\text{,}\) \(g(x) = x^2 - 4\text{,}\) and the basic parabola, \(y = x^2\text{.}\) By comparing tables of values, we can see exactly how the graphs of \(f\) and \(g\) are related to the basic parabola.
described in detail following the image
parabolas
Figure 5.5.
\(x\) \(-2\) \(-1\) \(~0~\) \(~~1~~\) \(~2~\)
\(y=x^2\) \(4\) \(1\) \(0\) \(1\) \(4\)
\(f(x)=x^2+4\) \(8\) \(5\) \(4\) \(5\) \(8\)
\(g(x)=x^2-4\) \(0\) \(-3\) \(-4\) \(-3\) \(0\)
Each \(y\)-value in the table for \(f (x)\) is four units greater than the corresponding \(y\)-value for the basic parabola \(y=x^2 \text{.}\) Consequently, each point on the graph of \(f (x)\) is four units higher than the corresponding point on the basic parabola, as shown by the arrows. Similarly, each point on the graph of \(g(x)\) is four units lower than the corresponding point on the basic parabola.
The graphs of \(y = f (x)\) and \(y = g(x)\) are said to be translations (or shifts) of the graph of \(y = x^2\text{.}\) They are shifted to a different location in the plane but retain the same size and shape as the original graph. In general, we have the following principles.

Vertical Shifts.

Let \(k\gt 0\text{.}\) Compared with the graph of \(y = f (x)\text{,}\)
  1. the graph of \(y=f(x)+k\) is shifted upward \(k\) units, and
  2. the graph of \(y=f(x)-k\) is shifted downward \(k\) units.

Example 5.6.

Graph the following functions.
  1. \(g(x) = \abs{x} + 3\) and \(y=\abs{x}\) and discuss how they are related.
  2. \(h(x) = \dfrac{1}{x}- 2\) and \(y=\frac{1}{x}\) and discuss how they are related.
Solution.
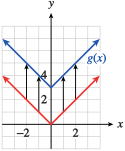
  1. The table shows that the \(y\)-values for \(g(x)\) are each three units greater than the corresponding \(y\)-values for the absolute value function. The graph of \(g(x) = \abs{x} + 3\) is a translation of the basic graph of \(y = \abs{x}\text{,}\) shifted upward three units, as shown in Figure 5.7.
    described in detail following the image
    translate absolute value
    Figure 5.7.
    \(x\) \(-2\) \(-1\) \(0\) \(1\) \(2\)
    \(y=\abs{x}\) \(2\) \(1\) \(0\) \(1\) \(2\)
    \(g(x)=\abs{x}+3\) \(5\) \(4\) \(3\) \(4\) \(5\)
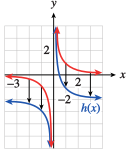
  2. The table shows that the \(y\)-values for \(h(x)\) are each two units smaller than the corresponding \(y\)-values for \(y = \dfrac{1}{x}\text{.}\) The graph of \(h(x) = \dfrac{1}{x} - 2\) is a translation of the basic graph of \(y = \dfrac{1}{x}\text{,}\) shifted downward two units, as shown in Figure 5.8.
    described in detail following the image
    translate reciprocal
    Figure 5.8.
    \(x\) \(-2\) \(-1\) \(\dfrac{1}{2}\) \(1\) \(2\)
    \(y=\dfrac{1}{x}\) \(\dfrac{-1}{2}\) \(-1\) \(2\) \(1\) \(\dfrac{1}{2}\)
    \(h(x)=\dfrac{1}{x}-2\) \(\dfrac{-5}{2}\) \(-3\) \(0\) \(-1\) \(\dfrac{-3}{2}\)

Example 5.9.

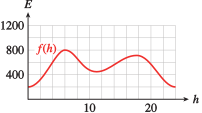
The function \(E = f (h)\) graphed in Figure 5.10 gives the amount of electrical power, in megawatts, drawn by a community from its local power plant as a function of time during a 24-hour period in 2002. Sketch a graph of \(y = f (h) + 300\) and interpret its meaning.
described in detail following the image
electrical power
Figure 5.10.
Solution.
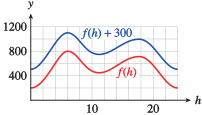
The graph of \(y = f (h) + 300\) is a vertical translation of the graph of \(f\text{,}\)
as shown in Figure 5.11. At each hour of the day, or for each value of \(h\text{,}\) the \(y\)-coordinate is 300 greater than on the graph of \(f\text{.}\) So at each hour, the community is drawing 300 megawatts more power than in 2002.
described in detail following the image
electrical power
Figure 5.11.

Example 5.12.

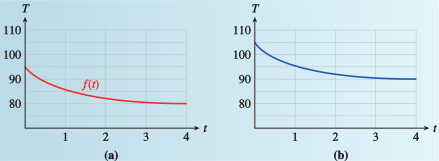
An evaporative cooler, or swamp cooler, is an energy-efficient type of air conditioner used in dry climates. A typical swamp cooler can reduce the temperature inside a house by 15 degrees. Figure 5.13a shows the graph of \(T = f (t)\text{,}\) the temperature inside Kate’s house \(t\) hours after she turns on the swamp cooler. Write a formula in terms of \(f\) for the function \(g\) shown in Figure 5.13b and, give a possible explanation of its meaning.
described in detail following the image
swamp cooler graphs
Figure 5.13.
Solution.
The graph of \(g\) is a vertical translation of \(f\text{,}\) \(10\) units up. Therefore \(g(t) = f (t) + 10\text{.}\) Its meaning could be that it measures the same thing as \(f\) but that the outside temperature was \(10\degree\) hotter.

Subsection 5.2.2 Horizontal Shift

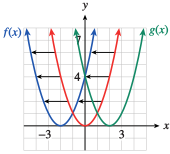
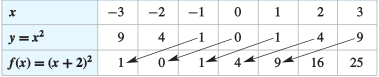
Now consider the graphs of \(f (x) = (x + 2)^2\) and \(g(x) = (x - 2)^2\) shown in Figure 5.14. Compared with the graph of the basic function \(y = x^2\text{,}\) the graph of \(f (x) = (x + 2)^2\) is shifted two units to the left, as shown by the arrows. You can see why this happens by studying the function values in the table.
described in detail following the image
swamp cooler graphs
Figure 5.14.
Locate a particular \(y\)-value for \(y = x^2\text{,}\) say, \(y = 4\text{.}\) You must move two units to the left in the table to find the same \(y\)-value for \(f (x)\text{,}\) as shown by the arrow. In fact, each \(y\)-value for \(f (x)\) occurs two units to the left when compared to the same \(y\)-value for \(y = x^2\text{.}\)
described in detail following the image
table for left translation
Figure 5.15.
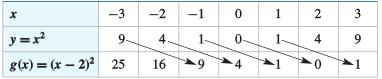
described in detail following the image
table for right translation
Figure 5.16.
Similarly, the graph of \(g(x) = (x - 2)^2\) is shifted two units to the right compared to the graph of \(y = x^2\text{.}\) In the table for \(g\text{,}\) each \(y\)-value for \(g(x)\) occurs two units to the right of the same \(y\)-value for \(y = x^2\text{.}\) In general, we have the following principle.

Horizontal Shifts.

Let \(h\gt 0\text{.}\) Compared with the graph of \(y = f (x)\text{,}\)
  1. the graph of \(y = f (x + h)~ ~\) is shifted \(h\) units to the left, and
  2. the graph of \(y = f (x - h)~ ~\) is shifted \(h\) units to the right.

Note 5.17.

At first, the direction of a horizontal translation may seem counterintuitive. Look again at the tables above to help you see how the shift occurs.

Example 5.18.

Graph the following functions.
  1. \(g(x) =\sqrt{x + 1}\) and \(y=\sqrt{x}\) and discuss how they are related.
  2. \(h(x) = \dfrac{1}{(x - 3)^2}\) and \(y=\dfrac{1}{x^2}\) and discuss how they are related.
Solution.
  1. Consider the table of values for the function.
    \(x\) \(-1\) \(0\) \(1\) \(2\) \(3\)
    \(y=\sqrt{x}\) undefined \(0\) \(1\) \(1.414\) \(1.732\)
    \(y=\sqrt{x+1}\) \(0\) \(1\) \(1.414\) \(1.732\) \(2\)
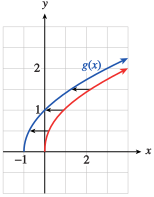
    The table shows that each \(y\)-value for \(g(x)\) occurs one unit to the left of the same \(y\)-value for the graph of \(y=\sqrt{x}\text{.}\) Consequently, each point on the graph of \(y = g(x)\) is shifted one unit to the left of \(y =\sqrt{x}\text{,}\) as shown in Figure 5.19.
    described in detail following the image
    horizontal shift of square root
    Figure 5.19.
  2. Consider the table of values for the function.
    \(x\) \(-1\) \(0\) \(1\) \(2\) \(3\) \(4\)
    \(y=\dfrac{1}{x}\) \(1\) undefined \(1\) \(\dfrac{1}{4}\) \(\dfrac{1}{9}\) \(\dfrac{1}{16}\)
    \(y=\dfrac{1}{(x-3)^2}\) \(\dfrac{1}{16}\) \(\dfrac{1}{9}\) \(\dfrac{1}{4}\) \(1\) undefined \(1\)
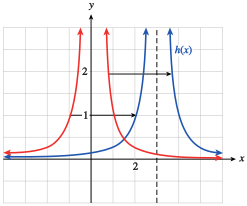
    The table shows that each \(y\)-value for \(h(x)\) occurs three units to the right of the same \(y\)-value for the graph of \(y =\dfrac{1}{x^2}\text{.}\) Consequently, each point on the graph of \(y = h(x)\) is shifted three units to the right of \(y =\dfrac{1}{x^2}\text{,}\) as shown in Figure 5.20.
    described in detail following the image
    horizontal shift of inverse square
    Figure 5.20.

Example 5.21.

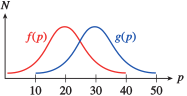
The function \(N = f (p)\) graphed in Figure 5.22 gives the number of people who have a given eye pressure level \(p\) measured in millimeters of mercury (mm Hg) from a sample of 100 people with healthy eyes, and the function \(g\) gives the number of people with pressure level \(p\) in a sample of 100 glaucoma patients.
described in detail following the image
shift of a bell-shaped curve
Figure 5.22.
  1. Write a formula for \(g\) as a transformation of \(f\text{.}\)
  2. For what pressure readings could a doctor be fairly certain that a patient has glaucoma?
Solution.
  1. The graph of \(g\) is translated \(10\) units to the right of \(f\text{,}\) so \(g(p) = f (p - 10)\text{.}\)
  2. Pressure readings above \(40\)mm Hg are a strong indication of glaucoma. Readings between \(10\) and \(40\)mm Hg cannot conclusively distinguish healthy eyes from those with glaucoma.

Example 5.23.

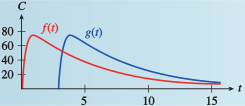
The function \(C = f (t)\) in Figure 5.24 gives the caffeine level in Delbert’s bloodstream at time \(t\) hours after he drinks a cup of coffee, and \(g(t)\) gives the caffeine level in Francine’s bloodstream. Write a formula for \(g\) in terms of \(f\text{,}\) and explain what it tells you about Delbert and Francine.
described in detail following the image
shift of caffeine surge curve
Figure 5.24.
Solution.
The graph of \(g\) is a horizontal translation of \(f\text{;}\) it appears to have been shifted about \(3\) units to the right. Thus \(g(t) = f (t - 3)\text{.}\) This could be because Francine drank her coffee \(3\) hours after Delbert drank his.

Example 5.25.

Graph \(f (x) = (x + 4)^3 + 2\text{.}\)
Solution.
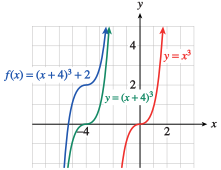
We identify the basic graph from the structure of the formula for \(f (x)\text{.}\) In this case, the basic graph is \(y = x^3\text{,}\) so we begin by locating a few points on that graph, as shown in Figure 5.26.
We will perform the translations separately, following the order of operations. First, we sketch a graph of \(y = (x + 4)^3\) by shifting each point on the basic graph four units to the left. We then move each point up two units to obtain the graph of \(f (x) = (x + 4)^3 + 2\text{.}\) All three graphs are shown in Figure 5.26.
described in detail following the image
translations of cubic curve
Figure 5.26.

Example 5.27.

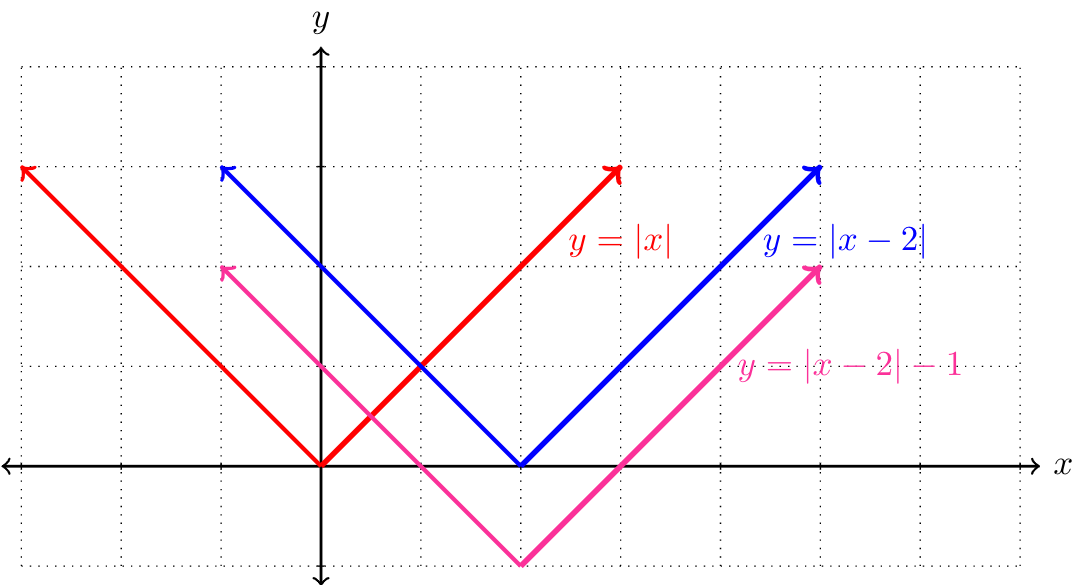
Graph the function \(f (x) = \abs{x - 2} - 1\text{.}\)
Solution.
We begin by graphing \(y=|x|\text{,}\) shifting it \(2\) units to the right to obtain \(y=|x-2|\text{,}\) and then shifting it \(1\) unit down to obtain \(y=|x-2|-1\text{.}\)
described in detail following the image
shifted absolute value

Exercises 5.2.3 Exercises

1. Comparing Shifted Functions.

Let \(f(x)=x^2\text{,}\) \(g(x)=x^2+1\text{,}\) and \(h(x)=(x+1)^2\text{.}\) Fill in the following table:
\(x\) -2 -1 0 1 2
\(f(x)\)
\(g(x)\)
\(h(x)\)
a) Which of the following statements best describes the differences in outputs of \(f(x)\) and \(g(x)\text{?}\)
b) Which of the following statements best describes the differences in outputs of \(f(x)\) and \(h(x)\text{?}\)
  • There is no relationship between the outputs of \(h(x)\) and the outputs of \(f(x)\text{.}\)
  • The outputs of \(h(x)\) are the same as the outputs of \(f(x)\) shifted to the right.
  • The outputs of \(h(x)\) are one more than the outputs of \(f(x)\text{.}\)
  • The outputs of \(h(x)\) are the same as the outputs of \(f(x)\) shifted to the left.
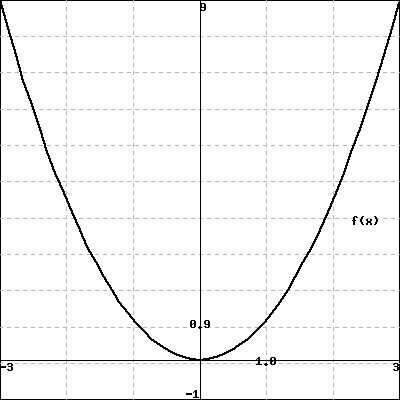
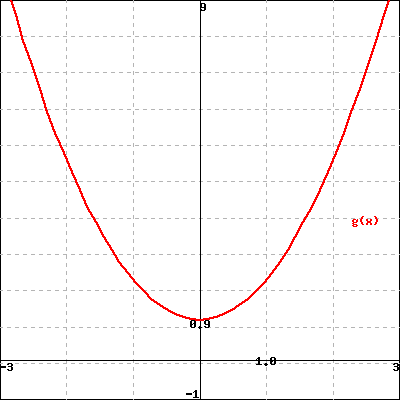
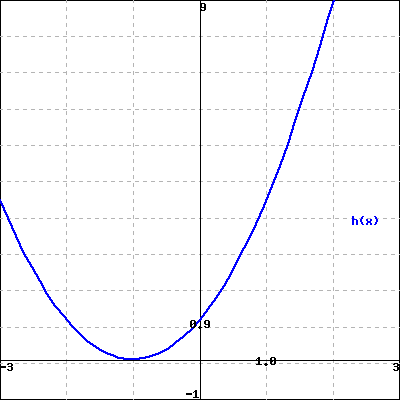
Consider the graphs of \(f(x)\text{,}\) \(g(x)\text{,}\) and \(h(x)\) given below.
c) Which of the following statements best describes the differences between the graphs of \(f(x)\) and \(g(x)\text{?}\)
d) Which of the following statements best describes the differences between the graphs of \(f(x)\) and \(h(x)\text{?}\)
Hint.
To fill out the table, we need to evaluate each function at the given \(x\) values for \(x=-2,-1,0,1,2\text{.}\) We can do this by just plugging in each of the \(x\) values to each function.
a) Compare the values of the outputs of \(f(x)\) and \(g(x)\text{.}\)
b) Compare the values of the outputs of \(f(x)\) and \(h(x)\text{.}\)
c) Compare the graphs of \(f(x)\) and \(g(x)\text{.}\)
d) Compare the graphs of \(f(x)\) and \(h(x)\text{.}\)

2. Shifting Function Values.

A backpacker is ascending a mountain. He begins at 5981 feet above sea level. The number of feet he has climbed \(t\) hours after beginning is given by \(f(t)\text{.}\)
a) Fill in the values for \(g(t)\text{,}\) his elevation above sea level at time \(t\text{.}\)
\(t\) 0 1 2 3 4 5
\(f(t)\) 0 1874 3461 5013 6849 7758
\(g(t)\)
b) Write \(g(t)\) as a formula in terms \(f(t)\text{.}\)
\(g(t)=\)
Hint.
a) To fill out the table, we have that \(g(t)\) gives the backpacker’s elevation above sea level at time \(t)\text{.}\) Since he starts at 5981 feet above sea level and \(f(t\) gives how much he has climbed \(t\) hours since he started his trek, we can find the values of \(g(t)\) by adding 5981 to the output values of \(f(t)\) at each value of \(t\) in the table.
b) To write an equation for \(g(t)\) in terms of \(f(t)\text{,}\) we do exactly what we did for each output of \(f(t)\) in the table for the entire function. In other words, the output values of \(g(t)\) are the same as the output values of \(f(t)\) plus 5981.
Another way to think about this is that the graph of \(g(t)\) would be the graph of \(f(t)\) shifted up by 5981.

3. Shifting Function Equations.

Suppose \(P(t) = 3.8 t + 5\) gives the profit of a company in thousands of dollars \(t\) months after January 1, 2014. At the monthly meetings with her staff, the CEO reports the company’s profits 5 months ago and their expected profits 5 months in the future.
a) What two figures does the CEO report on July 1, 2014?
Profit from 5 months ago: thousand dollars
Profit projected for 5 months in the future: thousand dollars
b) What figures does the CEO report \(t\) months after January 2014? Write your answer as an expression with \(P(t)\text{.}\)
Profit from 5 months ago:
Profit projected for 5 months in the future:
Hint.
a) The CEO will report profits from 5 months ago and the expected profit 5 months from July 1, 2014. Since July 1, 2014 means \(t=6\text{,}\) the CEO will report profit for \(t=6-5=1\) and \(t=6+5=11\text{.}\) What are the profit values for both of these \(t\)-values.
b) Using a similar idea to what we just did for any value of \(t\text{,}\) we know that to find the previous profit, we need to evaluate \(P\) at the input value \(t-5\text{.}\) Think about an expression that gives this value for any \(t\text{.}\)
Similarly, to find the future profit, we need to evaluate \(P\) at the input value \(t+5\text{.}\) Think about an expression that gives this value for any \(t\text{.}\)

4. Finding Explicit Formulas.

Find explicit formulas (in terms of \(x\)) for the following functions, and describe in words how the graphs of the following functions differ from \(f(x) = \sqrt{x}\text{.}\) For example, the explicit form of \(g(x)=f(x)+2\) would be \(g(x)=\sqrt{x}+2\text{.}\)
a) \(g(x) = f(x) + 9 =\)
The graph of \(g(x)\) is the same as the graph of \(f(x)\) shifted
by .
b) \(h(x) = f(x) - 8 =\)
The graph of \(h(x)\) is the same as the graph of \(f(x)\) shifted
by .
c) \(j(x) = f(x) - \sqrt{4}=\)
The graph of \(j(x)\) is the same as the graph of \(f(x)\) shifted
by .
Hint.
In order to write an explicit formula, we want to use the fact that we know \(f(x)=\sqrt{x}\) and evaluate the given composition. To answer the rest of each question, recall the following information:
For \(k>0\text{,}\) when compared to the graph of \(f(x)\text{,}\)
- the graph of \(y=f(x)+k\) is shifted up by \(k\text{.}\)
- the graph of \(y=f(x)-k\) is shifted down by \(k\text{.}\)

5. Finding Explicit Formulas.

Find explicit formulas (in terms of \(x\)) for the following functions, and describe in words how the graphs of the following functions differ from \(f(x) = \sqrt{x}\text{.}\) For example, the explicit form of \(g(x)=f(x+2)\) would be \(g(x)=\sqrt{x+2}\text{.}\)
a) \(p(x) = f(x + 2)=\)
The graph of \(p(x)\) is the same as the graph of \(f(x)\) shifted
by .
b) \(q(x) = f(x + 10)=\)
The graph of \(q(x)\) is the same as the graph of \(f(x)\) shifted
by .
c) \(r(x) = f(x - \log(6))=\)
The graph of \(r(x)\) is the same as the graph of \(f(x)\) shifted
by .
Hint.
In order to write an explicit formula, we want to use the fact that we know \(f(x)=\sqrt{x}\) and evaluate the given composition. To answer the rest of each question, recall the following information:
For \(h>0\text{,}\) when compared to the graph of \(f(x)\text{,}\)
- the graph of \(y=f(x+h)\) is shifted left by \(h\text{.}\)
- the graph of \(y=f(x-h)\) is shifted right by \(h\text{.}\)

6. Finding Formulas from Graphs.

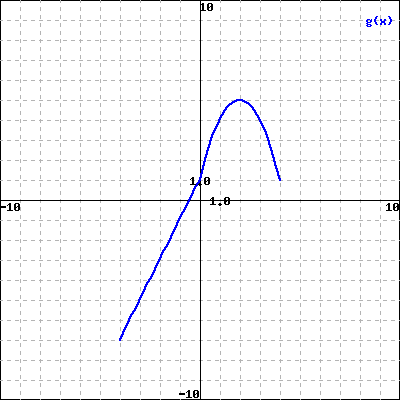
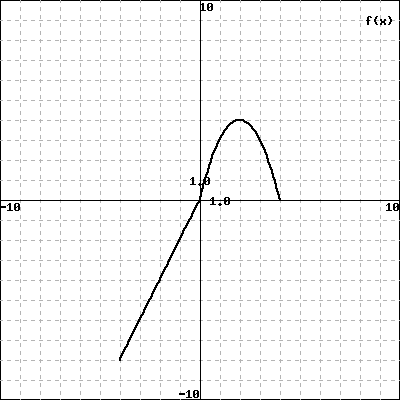
The following is a graph of \(f(x)\text{.}\)
(Click on graph to enlarge)
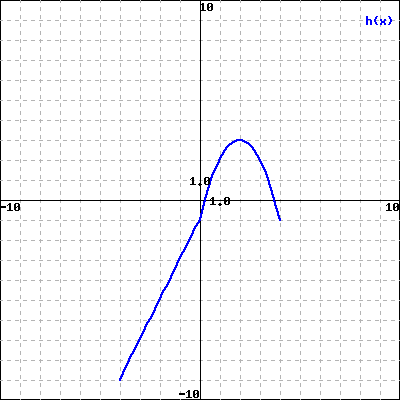
Find formulas for the functions graphed below in terms of \(f(x)\text{.}\)
(Click on graph to enlarge)
\(g(x)=\)
(Click on graph to enlarge)
\(h(x)=\)
Hint.
For each of the graphs, we will begin by identifying what transformation has occurred. From there, we will write the equation in terms of \(f(x)\text{.}\)
a) We see that the graph of \(g(x)\) is the same as the graph of \(f(x)\) shifted up by 1. What formula gives us that information?
b) We see that the graph of \(h(x)\) is the same as the graph of \(f(x)\) shifted up by 1. What formula gives us that information?

7. Finding Formulas from Graphs.

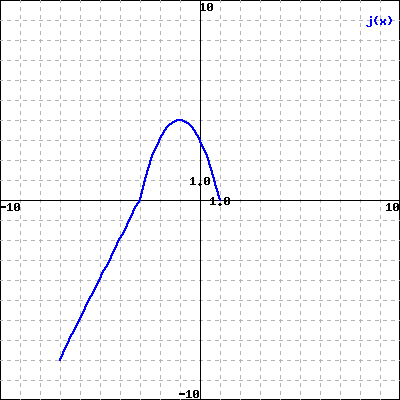
The following is a graph of \(f(x)\text{.}\)
(Click on graph to enlarge)
Find formulas for the functions graphed below in terms of \(f(x)\text{.}\)
(Click on graph to enlarge)
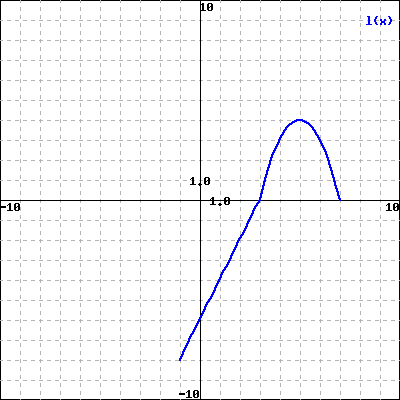
\(j(x)=\)
(Click on graph to enlarge)
\(l(x)=\)
Hint.
For each of the graphs, we will begin by identifying what transformation has occurred. From there, we will write the equation in terms of \(f(x)\text{.}\)
a) We see that the graph of \(j(x)\) is the same as the graph of \(f(x)\) shifted left by 3. What formula will give this information?
b) We see that the graph of \(l(x)\) is the same as the graph of \(f(x)\) shifted right by 3. What formula will give this information?

8. Matching Transformations.

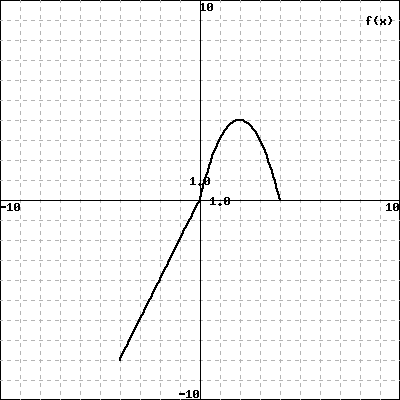
Let \(f(x)\) be given by the (large) graph to the right. On a piece of paper, graph and label each equation listed below. Then, match each formula with its graph from the list A-I below. Pay careful attention to the axes in the graph on the right, and on the graphs below. In all pictures, each tick mark represents a length of 1 unit. \(y = f(x-2)\) \(y=f(x+5)-3\) \(y = f(x-2)+5\) \(y = f(x)-1\)
\(y = f(x)\)
A B C
D E F
(Click on a graph to enlarge it)
Hint.
To answer each part, try to determine what transformation has occurred in the given equation using the information below. Choose the graph that has that transformation.
For \(k>0\text{,}\) when compared to the graph of \(f(x)\text{,}\)
- the graph of \(y=f(x)+k\) is shifted up by \(k\text{.}\)
- the graph of \(y=f(x)-k\) is shifted down by \(k\text{.}\)
For \(h>0\text{,}\) when compared to the graph of \(f(x)\text{,}\)
- the graph of \(y=f(x+h)\) is shifted left by \(h\text{.}\)
- the graph of \(y=f(x-h)\) is shifted right by \(h\text{.}\)

9. Domain and Range of Shifted Functions.

For each of the following functions, give the domain and range, and evaluate at \(x=0\text{.}\)
a) \(f(x)=\sqrt{x}\)
Domain:
Range:
\(f(0)=\)
b) \(f(x)=\sqrt{x}+14\)
Domain:
Range:
\(f(0)=\)
c) \(f(x)=\sqrt{x}-30\)
Domain:
Range:
\(f(0)=\)
Hint.
a) For the domain, recall that the square root function is not defined for negative values of \(x\text{.}\) In other words, we can not take the square root of a negative number. Think about what that means for the domain of the function. Use that information to help you find the range as well.
b) Note here that \(f(x)=\sqrt{x}+14\) gives us a vertical shift. In particular, the graph of \(f(x)=\sqrt{x}+14\) is the graph of \(y=\sqrt{x}\) shifted up by 14. Think about whether this will change the input values or the output values. Does that change the domain or the range?
c) Using a similar idea to part b), we see that the graph of \(f(x)=\sqrt{x}-30\) is the graph of \(y=\sqrt{x}\) shifted down by 30. Think about whether this will change the input values or the output values. Does that change the domain or the range?

10. Domain and Range of Shifted Functions.

For each of the following functions, give the domain and range, and find the \(x\) value for which \(f(x)=5\text{.}\)
a) \(f(x)=\sqrt{x}\)
Domain:
Range:
\(x=\)
b) \(f(x)=\sqrt{x+17}\)
Domain:
Range:
\(x=\)
c) \(f(x)=\sqrt{x-20}\)
Domain:
Range:
\(x=\)
Hint.
a) For the domain, recall that the square root function is not defined for negative values of \(x\text{.}\) In other words, we can not take the square root of a negative number. Think about what that means for the domain of the function. Use that information to help you find the range as well.
b) Note here that \(f(x)=\sqrt{x+17}\) gives us a horizontal shift. In particular, the graph of \(f(x)=\sqrt{x+17}\) is the graph of \(y=\sqrt{x}\) shifted left by 17. Think about whether this will change the input values or the output values. Does that change the domain or the range?
c) Using a similar idea to part b), we see that the graph of \(f(x)=\sqrt{x-20}\) is the graph of \(y=\sqrt{x}\) shifted right by 20. Think about whether this will change the input values or the output values. Does that change the domain or the range?

11. Writing New Formulas from Shifts.

The cost of renting a limo has a flat fee of $ 110 plus $ 30 per hour.
a) Find a formula for \(C(x)\text{,}\) the total cost for renting a limo for \(x\) hours.
\(C(x)=\)
b) If the flat fee is raised by $ 25, let \(D(x)\) give the new total cost function. Which of the following equations expresses \(D(x)\) as a transformation of \(C(x)\text{?}\)
c) The limo driver increases the flat fee by $ 25, and leaves the cost per hour as $ 30, but includes the first hour for free. Let \(F(x)\) give the new total cost. Which of the following equations expresses \(F(x)\) as a transformation of \(C(x)\text{?}\)
Hint.
a) We are given that the cost of renting a limo has a flat fee of 110 plus 30 per hour, which means this is a linear function. This means that \(C(x)\) will have the form \(C(x)=mx+b\text{,}\) where \(m\) is the slope and \(b\) is the initial value.
b) Since the flat fee is being increased by 25, we know that the outputs of \(C(x)\) will all be increased by 25. What does that mean in terms of the equation?
c) Similarly to part b), we are keeping the increase in the flat fee of 25. That means we will add 25 to \(C(x)\) here as well. In this case, we are getting the first hour free. That means if the limo is rented for 2 hours, we will only pay for 1, for example. What does that mean in terms of the equation?

12. Combining Shifts.

The function \(g(x)\) is pictured below.
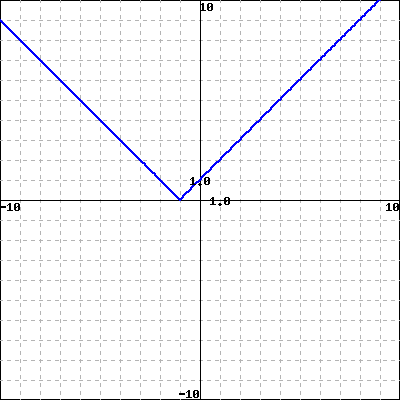
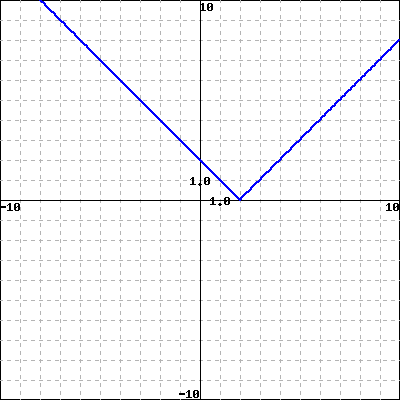
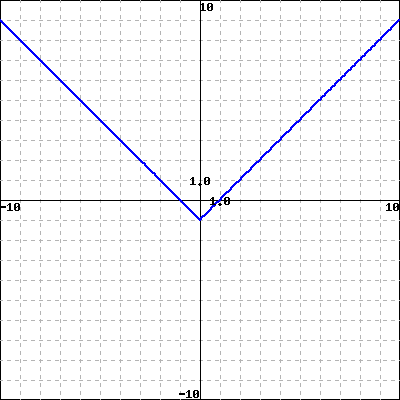
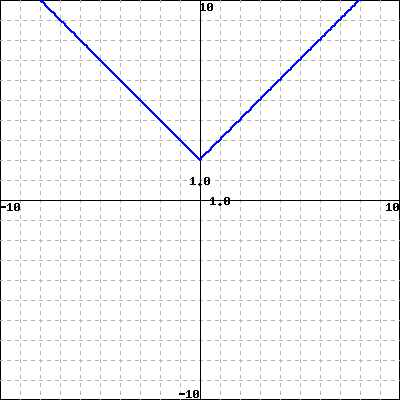
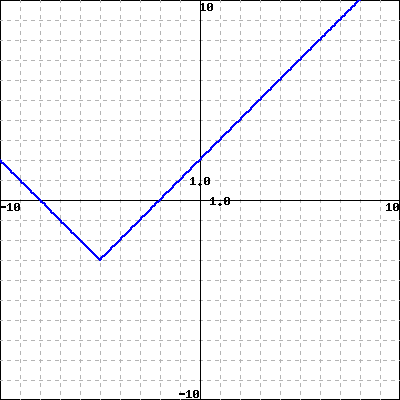
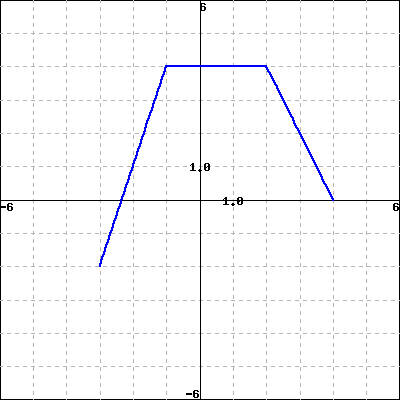
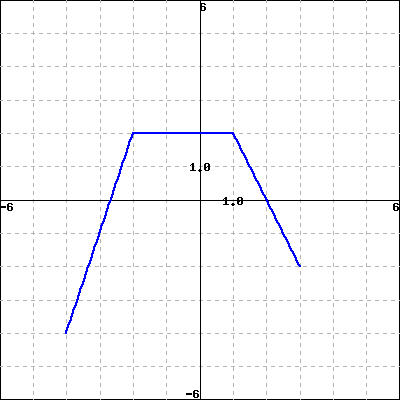
Which of the following graphs is the graph of the function \(g(x+2)-1\text{?}\)
A B
C D
(Click on a graph to enlarge it)
Hint.
Try to determine what transformations have occurred in the given equation using the information below. Choose the graph that has those transformation.
For \(k>0\text{,}\) when compared to the graph of \(f(x)\text{,}\)
- the graph of \(y=f(x)+k\) is shifted up by \(k\text{.}\)
- the graph of \(y=f(x)-k\) is shifted down by \(k\text{.}\)
For \(h>0\text{,}\) when compared to the graph of \(f(x)\text{,}\)
- the graph of \(y=f(x+h)\) is shifted left by \(h\text{.}\)
- the graph of \(y=f(x-h)\) is shifted right by \(h\text{.}\)

13. Interpreting Shifts.

Suppose that the population of Town A in thousands of people \(t\) years after 1990 is given by \(P(t)\text{,}\) shown in the graph below.
a) Suppose Town B has a population given by \(P(t)+5\text{.}\)
i) What is Town B’s population in 1993? thousand people
ii) What is Town B’s population in 1995? thousand people
iii) Which of the following gives the most appropriate interpretation the population of Town B in terms of the population of Town A?
b) Suppose Town C has a population given by \(P(t-2)\text{.}\)
i) What is Town C’s population in 1992? thousand people
ii) What is Town C’s population in 1998? thousand people
Which of the following gives the most appropriate interpretation of the population of Town C in terms of the population of Town A?
Hint.
a) We have that the population of Town B is given by \(P(t)+5\text{.}\) Thus, we can view this as a vertical shift up by 5 from the graph of \(P(t)\) given here. Note that \(t\) is the number of years since 1990.
i) To find the population of Town B in 1993, we want to find the population of Town A in 1993 and add 5 to it.
ii) We will use the same process to find the population of Town B in 1995.
iii) To interpret the population of Town B in terms of the population of Town A, we have that we increase the value of \(P(t)\) by 5. Note that the value 5 here is actually representing 5 thousand people.
b) We have that the population of Town C is given by \(P(t-2)\text{.}\) Thus, we can view this as a horizontal shift right by 2 from the graph of \(P(t)\) given here. Note, again, that \(t\) is the number of years since 1990.
i) To find the population of Town C in 1992, we want to find the population of Town A 2 years before 1992.
Notice here that we can think of this in the following way: "The population of Town C for \(t\) is the same as the population of Town A for \(t-2\text{.}\)"
ii) We will use the same process to find the population of Town C in 1998.
iii) To interpret the population of Town C in terms of Town A, we have that we subtract 2 from the value of \(t\) before using the function \(P(t)\text{.}\) This means that we are looking at the population of Town A from 2 year(s) ago.