Josh Brummer, Taran Funk, Lawrence Seminario-Romero, Ariel Setniker, Karina Uhing, Nathan Wakefield, Catherine Zimmitti, The Mabel Elizabeth Kelly Fund
Many phenomena can be modeled using linear functions \(y = f (x)\) where the equations have the form
\begin{equation*}
f (x) = (\text{starting value}) + (\text{rate of change}) \cdot x.
\end{equation*}
The rate of change is the slope of the graph, and the initial value is the value of \(f(0)\text{.}\) On the graph of \(f\text{,}\) the initial value corresponds to the point that lies on the vertical axis.
A vertical intercept is a point where a graph intersects the vertical axis. For a function \(f\text{,}\) the vertical intercept of the graph of \(f\) is the point \((0,f(0))\text{.}\) Because we often use the variable \(y\) on the vertical axis, the vertical intercept is often called the \(y\)-intercept.
We will often abuse notation and say that the \(y\)-intercept of a graph is \(b\text{.}\) What we really mean is that the \(y\)-intercept is the point \((0,b)\text{.}\)
We can write the equation for a linear function explicitly as
\begin{equation*}
f (x) = b + mx
\end{equation*}
where the constant term, \(b\text{,}\) is the \(y\)-intercept and \(m\text{,}\) the coefficient of \(x\text{,}\) is the slope of the line. This form for an equation of a line is called the slope-intercept form .
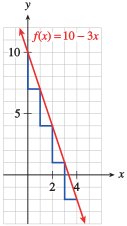
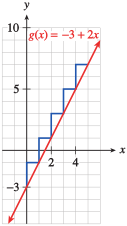
For each graph, the coefficient of \(x\) is a scale factor that tells us how many units \(y\) changes for \(1\) unit increase in \(x\text{.}\) But that is exactly what the slope tells us about a line.
An \(x\)-intercept is a point where a graph intersects the \(x\)-axis. It corresponds to the point \((a,0)\) where \(a\) is a value such that \(f(a)=0\text{.}\)
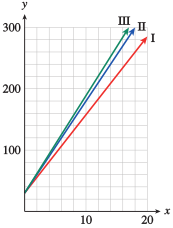
Francine pays the same initial amount, $30 for the modem, under each plan. The monthly fee is the rate of change of her total cost, in dollars per month. We can write a formula for her cost under each plan.
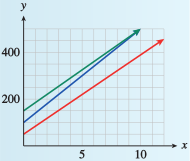
The graphs of these three functions all have the same \(y\)-intercept, but their slopes are determined by the monthly fees. The steepest graph, III, is the one with the largest monthly fee, peoplepc, and ISP.com, which has the lowest monthly fee, has the least steep graph, I.
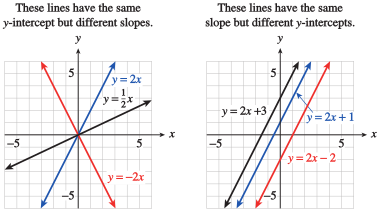
In the equation \(f (x) = b + mx\text{,}\) we call \(m\) and \(b\) parameters . Their values are fixed for any particular linear equation; for example, in the equation \(y = 2x + 3\text{,}\)\(m = 2\) and \(b = 3\text{,}\) and the variables are \(x\) and \(y\text{.}\) By changing the values of \(m\) and \(b\text{,}\) we can write the equation for any line except a vertical line (see Figure 1.126). The collection of all linear functions \(f (x) = b + mx\) is called a two-parameter family of functions.
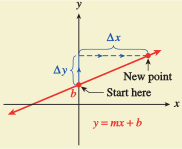
Look again at the lines in Figure 1.126: There is only one line that has a given slope and passes through a particular point. That is, the values of \(m\) and \(b\) determine the particular line. The value of \(b\) gives us a starting point, and the value of \(m\) tells us which direction to go to plot a second point. Thus, we can graph a line given in slope-intercept form without having to make a table of values.
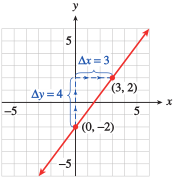
We see that the slope of the line is \(m = \dfrac{4}{3}\text{,}\) and its vertical intercept is \(b = -2\text{.}\) We begin by plotting the \(y\)-intercept, \((0, -2)\text{.}\) We then use the slope to find another point on the line. We have
\begin{equation*}
m = \frac{\Delta y}{\Delta x}=\frac{4}{3}
\end{equation*}
so starting at \((0, -2)\text{,}\) we move \(4\) units in the \(y\)-direction and \(3\) units in the \(x\)-direction, to arrive at the point \((3, 2)\text{.}\) Finally, we draw the line through these two points. (See Figure 1.128.)
The slope of a line is a ratio and can be written in many equivalent ways. In Example 1.127, the slope is equal to \(\dfrac{8}{6}\text{,}\)\(\dfrac{12}{9}\text{,}\) and \(\dfrac{-4}{-3}\text{.}\) We can use any of these fractions to locate a third point on the line as a check. If we use \(m = \dfrac{\Delta y}{\Delta x}= \dfrac{-4}{-3}\text{,}\) we move down \(4\) units and left \(3\) units from the \(y\)-intercept to find the point \((-3, -6)\) on the line.
Use the definition of slope to find a second point on the line: Starting at the vertical intercept, move \(\Delta y\) units in the \(y\)-direction and \(\Delta x\) units in the \(x\)-direction. Plot a second point at this location.
Since we want our answer to have units miles per hour, we need to write 2 hours and 45 minutes in hours. So the time taken on the bike ride is 2.75 hours. The average rate of change will be given by the total number of miles traveled divided by the total number of hours.
In 2001, a 256 MB USB flash drive cost $ 155. In 2017, a pack of ten 256 MB USB flash drives can be purchased for $ 23. Assuming the value of a flash drive has depreciated linearly with time, write a formula giving the cost of a single 256 MB USB flash drive \(C\) as a function of \(t\) the number of years since 2001. For this problem you can assume that you don’t get any special discount for purchasing ten instead of one.
Since the input of the function is the number of years since 2001, we are given the initial value (vertical intercept). We know that 16 years later, the cost of a 10 pack is $ 23. Therefore, the cost of a single 256 MB USB flash drive costs $ 2.3. We need to use this information to calculate the slope. Recall the slope formula:
4.Interpreting the Components of a Linear Equation.
A child wants to make money by selling lemonade at their own lemonade stand. The cost, in dollars, of all the ingredients they need is $13.80. They decide to charge 0.6 dollars for a cup of lemonade, hence, their profit \(P(n)\) in dollars for selling \(n\) cups of lemonade is
A report by the US Geological Survey indicates that glaciers in Glacier National Park, Montana, are shrinking. Recent estimates indicate the area covered by glaciers has decreased from over \(25.5 \ \mbox{km}^2\) in 1850 to about \(16.51 \ \mbox{km}^2\) in 1995. Let \(A = f(t)\) give the area (in square km) \(t\) years after 2000, and assume \(f(t) = 16.2 - 0.062t\text{.}\)
c) For both expressions listed below, enter the letter A-E of the statement which correctly completes the sentence. There are extra, unused statements.
The number of years after 2000 that the total area covered by glaciers will be \(12 \ \mbox{km}^2\text{.}\)