Section 5.4 Vertical Stretches and Compressions

Subsection 5.4.1

We have seen that adding a constant to the expression defining a function results in a translation of its graph. What happens if we multiply the expression by a constant? Consider the graphs of the functions
\begin{equation*} f(x)= 2x^2 \text{, and } ~g(x)= \frac{1}{2}x^2 \end{equation*}
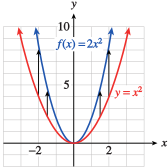
shown in Figure 5.32, and Figure 5.33. We will compare each to the graph of \(y = x^2\text{.}\)
described in detail following the image
2 x-sq and basic parabola
Figure 5.32.
\(x\) \(y=x^2\) \(f(x)=2x^2\)
\(-2\) \(4\) \(8\)
\(-1\) \(1\) \(2\)
\(0\) \(0\) \(0\)
\(1\) \(1\) \(2\)
\(2\) \(4\) \(8\)
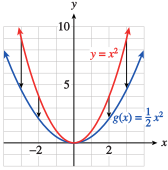
Compared to the graph of \(y = x^2\text{,}\) the graph of \(f (x) = 2x^2\) is expanded, or stretched, vertically by a factor of \(2\text{.}\) The \(y\)-coordinate of each point on the graph has been doubled, as you can see in the table of values, so each point on the graph of \(f\) is twice as far from the \(x\)-axis as its counterpart on the basic graph \(y = x^2\text{.}\)
described in detail following the image
half x-sq and basic parabola
Figure 5.33.
\(x\) \(y=x^2\) \(g(x)=\frac{1}{2}x^2\)
\(-2\) \(4\) \(2\)
\(-1\) \(1\) \(\frac{1}{2}\)
\(0\) \(0\) \(0\)
\(1\) \(1\) \(\frac{1}{2}\)
\(2\) \(4\) \(2\)
The graph of \(g(x) = \dfrac{1}{2}x^2\) is compressed vertically by a factor of \(2\text{;}\) each point is half as far from the \(x\)-axis as its counterpart on the graph of \(y = x^2\text{.}\)
In general, we have the following principles.

Vertical Stretches, Compressions, and Reflections.

Compared with the graph of \(y = f (x)\text{,}\) the graph of \(y = a f (x)\text{,}\) where \(a \ne 0\text{,}\) is
  1. stretched vertically by a factor of \(\abs{a}\) if \(\abs{a}\gt 1\text{,}\)
  2. compressed vertically by a factor of \(\frac{1}{\abs{a}}\) if \(0\lt\abs{a}\lt 1\text{,}\) and
  3. reflected about the \(x\)-axis (and stretched or compressed) if \(a\lt 0\text{.}\)
As you may have notice by now through our examples, a vertical stretch or compression will never change the \(x\) intercepts. This is a good way to tell if such a transformation has occurred.

Example 5.34.

Graph the following functions.
  1. \(\displaystyle g(x) = 3\sqrt[3]{x}\)
  2. \(\displaystyle h(x) =\dfrac{-1}{2}\abs{x}\)
Solution.
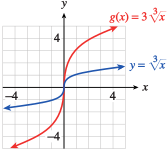
  1. The graph of \(g(x) = 3\sqrt[3]{x}\) is a vertical stretch of the basic graph \(y = \sqrt[3]{x}\) by a factor of \(3\text{,}\) as shown in Figure 5.35. Each point on the basic graph has its \(y\)-coordinate tripled.
    described in detail following the image
    scale cube root
    Figure 5.35.
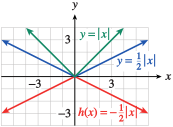
  2. The graph of \(h(x) = \dfrac{-1}{2}\abs{x}\) is a vertical compression of the basic graph \(y = \abs{x}\) by a factor of \(2\text{,}\) combined with a reflection about the \(x\)-axis. You may find it helpful to graph the function in two steps, as shown in Figure 5.36.
    described in detail following the image
    scale absolute value
    Figure 5.36.

Example 5.37.

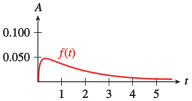
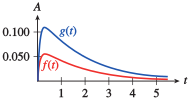
The function \(A = f (t)\) graphed in Figure 5.38 gives a person’s blood alcohol level \(t\) hours after drinking a martini. Sketch a graph of \(g(t) = 2 f (t)\) and explain what it tells you.
described in detail following the image
alcohol level after alcohol
Figure 5.38.
Solution.
To sketch a graph of \(g\text{,}\) we stretch the graph of \(f\) vertically by a factor of \(2\text{,}\) as shown in Figure 5.39. At each time \(t\text{,}\) the person’s blood alcohol level is twice the value given by \(f\text{.}\) The function \(g\) could represent a person’s blood alcohol level \(t\) hours after drinking two martinis.
described in detail following the image
alcohol level after more alcohol
Figure 5.39.

Example 5.40.

If the Earth were not tilted on its axis, there would be 12 daylight hours every day all over the planet. But in fact, the length of a day in a particular location depends on the latitude and the time of year.
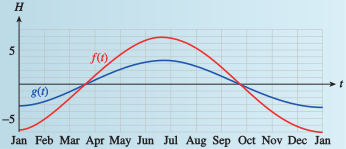
The graph in Figure 5.41 shows \(H = f (t)\text{,}\) the length of a day in Helsinki, Finland, \(t\) days after January 1, and \(R = g(t)\text{,}\) the length of a day in Rome. Each is expressed as the number of hours greater or less than 12. Write a formula for \(f\) in terms of \(g\text{.}\) What does this formula tell you?
described in detail following the image
daylight hours at two latitudes
Figure 5.41.
Solution.
\(f (t)\approx 2g(t)\text{.}\) On any given day, the number of daylight hours varies from \(12\) hours about twice as much in Helsinki as it does in Rome.
In the following applet, explore the properties of vertical stretches and compressions.
Figure 5.42. Explore the inverse relationship between between the functions \(f(t)=\log_b(t)\) and \(g(t)=b^t\) for various values of \(b>0\) with this applet.

Exercises 5.4.2 Exercises

1. Describing Shifts and Reflections.

Describe the shifts/reflections that can be applied to \(f(x)\) to obtain a graph of the following:
a) \(y = f(x-7)+7\)
  • Shift the graph of \(f(x)\) right by 7 and down by 7.
  • Shift the graph of \(f(x)\) left by 7 and down by 7.
  • Shift the graph of \(f(x)\) left by 7 and up by 7.
  • Shift the graph of \(f(x)\) right by 7 and up by 7.
b) \(y = f(x)+8\)
  • Shift the graph of \(f(x)\) left by 8.
  • Shift the graph of \(f(x)\) right by 8.
  • Shift the graph of \(f(x)\) up by 8.
  • Shift the graph of \(f(x)\) down by 8.
c) \(y=f(x+2)-7\)
  • Shift the graph of \(f(x)\) right by 2 and up by 7.
  • Shift the graph of \(f(x)\) left by 2 and down by 7.
  • Shift the graph of \(f(x)\) left by 2 and up by 7.
  • Shift the graph of \(f(x)\) right by 2 and down by 7.
d) \(y = f(x-9)\)
  • Shift the graph of \(f(x)\) down by 9.
  • Shift the graph of \(f(x)\) right by 9.
  • Shift the graph of \(f(x)\) up by 9.
  • Shift the graph of \(f(x)\) left by 9.
e) \(y=f(-x)\)
  • Reflect the graph of \(f(x)\) over the \(x\)-axis.
  • Shift the graph of \(f(x)\) up by 1.
  • Reflect the graph of \(f(x)\) over the \(y\)-axis.
  • Shift the graph of \(f(x)\) left by 1.
f) \(y = f(x+5)\)
  • Shift the graph of \(f(x)\) right by 5.
  • Shift the graph of \(f(x)\) down by 5.
  • Shift the graph of \(f(x)\) up by 5.
  • Shift the graph of \(f(x)\) left by 5.
Hint.
Recall the following rules about function transformation:
-- \(y=f(x)+k\) means the graph of \(f(x)\) has been shifted up (for \(k>0\)) or shifted down (for \(k\lt 0\)).
-- \(y=f(x+h)\) means the graph of \(f(x)\) has been shifted left (for \(h>0\)) or shifted right (for \(h\lt 0\)).
-- \(y=-f(x)\) means the graph of \(f(x)\) has been reflected over the \(x\)-axis.
-- \(y=f(-x)\) means the graph of \(f(x)\) has been reflected over the \(y\)-axis.
Use this information to help you choose the right option.

2. Exploring Vertical Compressions and Stretches.

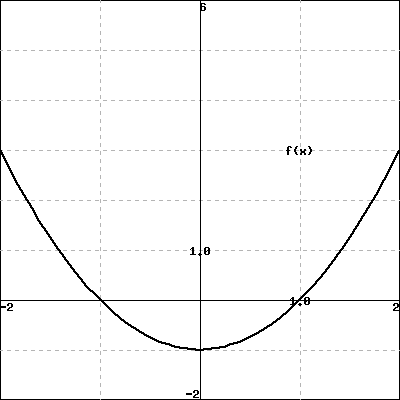
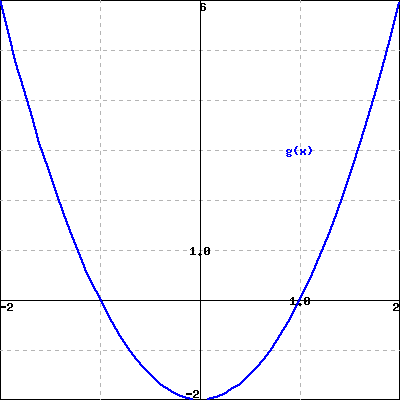
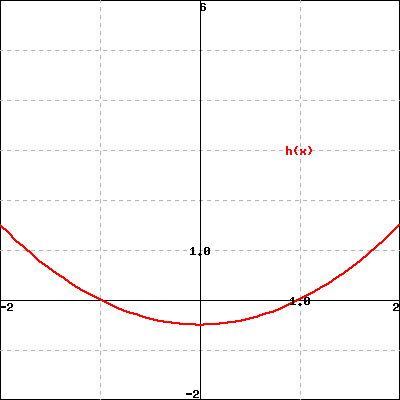
Let \(f(x)=x^2-1\text{,}\) \(g(x)=2f(x)=2(x^2-1)\text{,}\) and \(h(x)=.5f(x)=.5(x^2-1)\text{.}\) Fill in the following table:
\(x\) -2 -1 0 1 2
\(f(x)\)
\(g(x)\)
\(h(x)\)
The following are graphs of the functions \(f(x)\text{,}\) \(g(x)\text{,}\) and \(h(x)\text{.}\)
a) Which of the following statements best describes the differences between the graphs of \(f(x)\) and \(g(x)\text{?}\)
  • The graph of \(g(x)\) is a horizontal stretch of the graph of \(f(x)\text{.}\)
  • The graph of \(g(x)\) is a vertical stretch of the graph of \(f(x)\text{.}\)
  • The graph of \(g(x)\) is a vertical compression of the graph of \(f(x)\text{.}\)
  • The graph of \(g(x)\) is a horizontal compression of the graph of \(f(x)\text{.}\)
b) Which of the following statements best describes the differences between the graphs of \(f(x)\) and \(h(x)\text{?}\)
  • The graph of \(g(x)\) is a horizontal compression of the graph of \(f(x)\text{.}\)
  • The graph of \(g(x)\) is a vertical stretch of the graph of \(f(x)\text{.}\)
  • The graph of \(g(x)\) is a vertical compression of the graph of \(f(x)\text{.}\)
  • The graph of \(g(x)\) is a horizontal stretch of the graph of \(f(x)\text{.}\)
c) Assume \(a>1\) and \(f(x)\) is a function. Based on your work above, try to write an implicit formula (a function in terms of \(f(x)\text{,}\) e.g. \(g(x)=2f(x)\)) for the following:
i) The graph of \(g(x)=\) is the graph of \(f(x)\) vertically stretched by a factor of \(a\text{.}\)
The graph of \(g(x)=\) is the graph of \(f(x)\) vertically compressed by a factor of \(a\text{.}\)
Hint.
We can fill in the table by evaluating each of the given functions at the values of \(x\) in the table.
a) We see that the graph of \(g(x)\) looks like it has been pulled away from the \(x\)-axis. Think about which description best fits this concept.
b) We see the the graph of \(h(x)\) looks like it has been pushed towards the \(x\)-axis. Think about which description best fits this concept.
c) To come up with the formulas, let’s use what happened with \(g(x)\) and \(h(x)\) to help figure out the general rule.
We know that \(g(x)=2f(x)\) resulted in a vertical stretch and \(h(x)=.5f(x)=\dfrac{1}{2}f\left(x\right)\) resulted in a vertical compression. Think about what would happen if we took \(af(x)\) and \(\dfrac{1}{a}f(x)\text{,}\) where \(a>1\text{.}\) Which of these do you think gives the vertical stretch and which do you think gives the vertical compression, based on what we saw above?
3. Describing Vertical Compressions and Stretches.

Find explicit formulas (in terms of \(x\)) for the following functions, and describe in words how the graphs of the following functions differ from \(f(x) = 3^x+8\text{.}\) For example, the explicit form of \(g(x)=f(x)+2\) would be \(g(x)=(3^x+8)+2\text{.}\)
a) \(g(x) = 5 f(x)=\)
The graph of \(g(x)\) is the same as the graph of \(f(x)\) vertically
by .
b) \(h(x) = \frac{1}{3}f(x) =\)
The graph of \(h(x)\) is the same as the graph of \(f(x)\) vertically
by .
c) \(j(x) = 3f(x - 4)=\)
The graph of \(j(x)\) is the same as the graph of \(f(x)\) shifted
by and vertically
by a factor of .
d) \(k(x) = \frac{7}{9}f(x + 4)=\)
The graph of \(j(x)\) is the same as the graph of \(f(x)\) shifted
by and vertically
by a factor of .
Hint.
In order to write an explicit formula, we want to use the fact that we know \(f(x)=3^x+8\text{.}\) To answer the rest of each question, recall the following information:
When compared to the graph of \(f(x)\text{,}\)
- the graph of \(y=af(x)\) is vertically stretched by a factor of \(a\) when \(a>1\text{.}\)
- the graph of \(y=af(x)\) is vertically compressed by a factor of \(\dfrac{1}{a}\) when \(0\lt a\lt 1\text{.}\)
For parts c) and d), we have a shift. Recall the following information.
For \(k>0\text{,}\) when compared to the graph of \(f(x)\text{,}\)
- the graph of \(y=f(x)+k\) is shifted up by \(k\text{.}\)
- the graph of \(y=f(x)-k\) is shifted down by \(k\text{.}\)
For \(h>0\text{,}\) when compared to the graph of \(f(x)\text{,}\)
- the graph of \(y=f(x+h)\) is shifted left by \(h\text{.}\)
- the graph of \(y=f(x-h)\) is shifted right by \(h\text{.}\)

4. Graphing Vertical Compressions and Stretches.

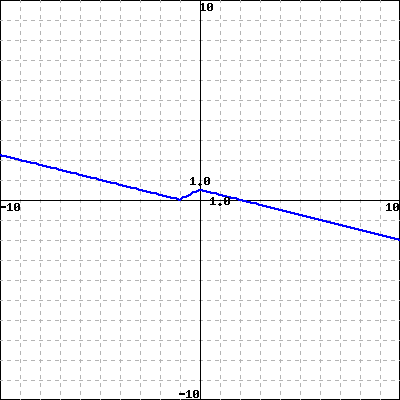
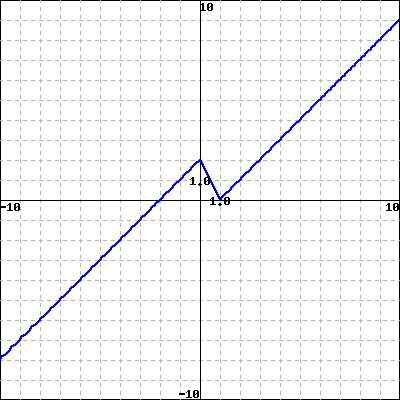
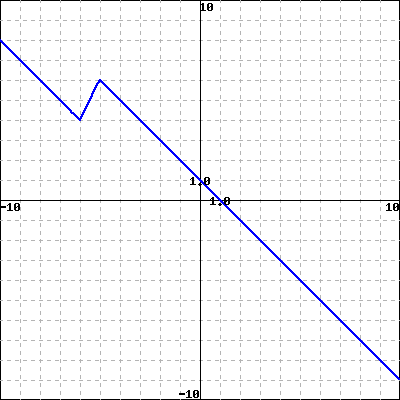
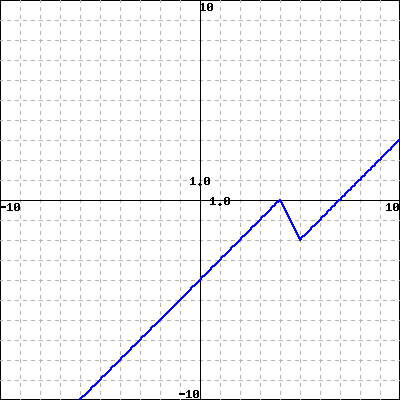
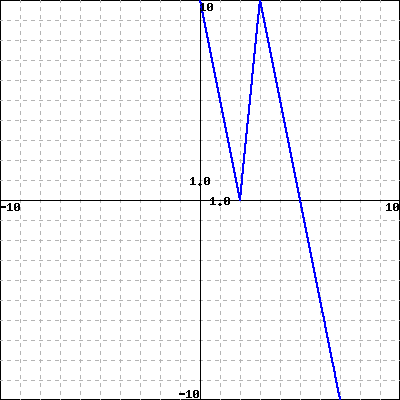
Let \(f(x)\) be given by the (large) graph to the right. On a piece of paper, graph and label each equation listed below. Then, match each formula with its graph from the list A-D below. Pay careful attention to the axes in the graph on the right, and on the graphs below. In all pictures, each tick mark represents a length of 1 unit. \(y=5f(x-3)\) \(y = f(-x)\) \(y = -f(x-5)\) \(y =2 f(x)\)
\(y = f(x)\)
A B C
D E F
(Click on a graph to enlarge it)
Hint.
For each of the graphs, the following information may be useful. It would be a good idea to try to identify the transformation(s) first and chose the graph that has those transformation(s) applied to the original. You may want to pick a couple of key points on the graph to follow to make this choice.
When compared to the graph of \(f(x)\text{,}\)
- the graph of \(y=af(x)\) is vertically stretched by a factor of \(a\) when \(a>1\text{.}\)
- the graph of \(y=af(x)\) is vertically compressed by a factor of \(\dfrac{1}{a}\) when \(0\lt a\lt 1\text{.}\)
For \(k>0\text{,}\) when compared to the graph of \(f(x)\text{,}\)
- the graph of \(y=f(x)+k\) is shifted up by \(k\text{.}\)
- the graph of \(y=f(x)-k\) is shifted down by \(k\text{.}\)
For \(h>0\text{,}\) when compared to the graph of \(f(x)\text{,}\)
- the graph of \(y=f(x+h)\) is shifted left by \(h\text{.}\)
- the graph of \(y=f(x-h)\) is shifted right by \(h\text{.}\)
When compared to the graph of \(f(x)\text{,}\)
- the graph of \(y=-f(x)\) is reflected over the \(x\)-axis.
- the graph of \(y=f(-x)\) is reflected over the \(y\)-axis.