Josh Brummer, Taran Funk, Lawrence Seminario-Romero, Ariel Setniker, Karina Uhing, Nathan Wakefield, Catherine Zimmitti, The Mabel Elizabeth Kelly Fund
A function may be defined by different formulas on different portions of the \(x\)-axis. Such a function is said to be defined piecewise . To graph a function defined piecewise, we consider each piece of the \(x\)-axis separately.
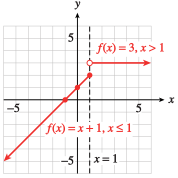
Think of the plane as divided into two regions by the vertical line \(x = 1\text{,}\) as shown in Figure 2.5. In the left-hand region (\(x \le 1\)), we graph the line \(y = x + 1\text{.}\) (The fastest way to graph the line is to plot its intercepts, \((-1, 0)\) and \((0, 1)\text{.}\))
Notice that the value \(x = 1\) is included in the first region, so \(f (1) = 1 + 1 = 2\text{,}\) and the point \((1, 2)\) is included on the graph. We indicate this with a solid dot at the point \((1, 2)\text{.}\) In the right-hand region (\(x \gt 1\)), we graph the horizontal line \(y = 3\text{.}\) The value \(x = 1\) is not included in the second region, so the point \((1, 3)\) is not part of the graph. We indicate this with an open circle at the point \((1, 3)\text{.}\)
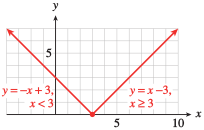
In the first region, \(x \ge 3\text{,}\) we graph the line \(y = x - 3\text{.}\) Because \(x = 3\) is included in this region, the endpoint of this portion of the graph, \((3, 0)\text{,}\) is included, too.
In the second region, \(x \lt 3\text{,}\) we graph the line \(y = -x + 3\text{.}\) Note that the two pieces of the graph meet at the point \((0, 3)\text{,}\) as shown in Figure 2.8.
To identify the domain and range of a piecewise function, we recall that a piecewise function is defined by different functions each with corresponding domains.
Then the domain of the piecewise function is the combination of these domains, and the range of the piecewise function is the combination of the ranges of the functions on their corresponding domains. This idea is better illustrated in the following example.
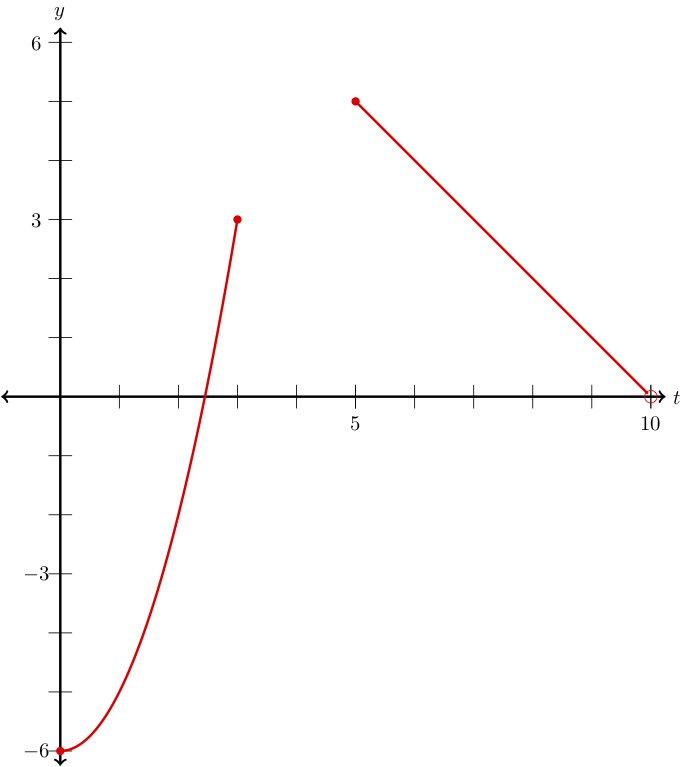
Each of the functions which make up \(f\) were considered in the Domain and Range Section 1.3 as examples. Putting together the two graphs, we get the graph of \(f \text{:}\)
In the Domain and Range Section 1.3 we found that the range of \(x^2-6\) on the domain \(0\le x\le 4\) is \([-6,10]\text{.}\) Additionally, we found that the range of \(-x+10\) on the domain \(5\le x\lt 10\) is \((0,5]\text{.}\) Then the range of \(f \) is the combination of these two ranges:
Determine which values of \(x\) would cause the function \(g\left(x\right) = \dfrac{1}{x + 3}\) to be undefined. What does this tell you about the domain of \(g(x)\text{?}\)
We want to find where the function \(g(x)=\frac{1}{x + 3}\) is undefined to help us find the domain. We have an undefined fraction when we divide by 0.
a) For this part, we want to evaluate the function at several input values. We will need to look at the value of each input and compare it to the restrictions on the function to see which piece of the function we need to use.
b) To find the domain of this function, we need to figure out all the possible input values where the function is defined. We can do this by looking at the restrictions for each piece of the function.
Pay close attention to the inequalities to see if there are any values of \(x\) that are not included here. Make sure you also combine any intervals you can.
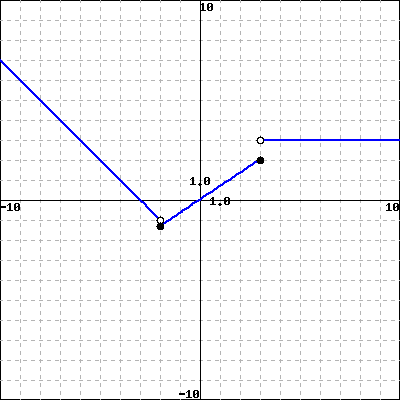
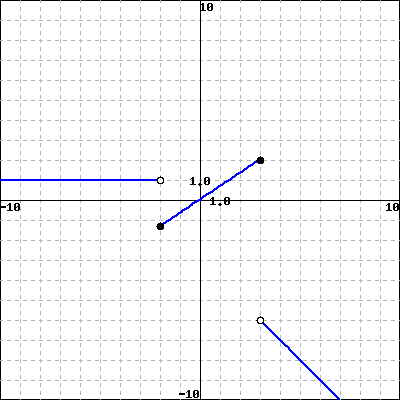
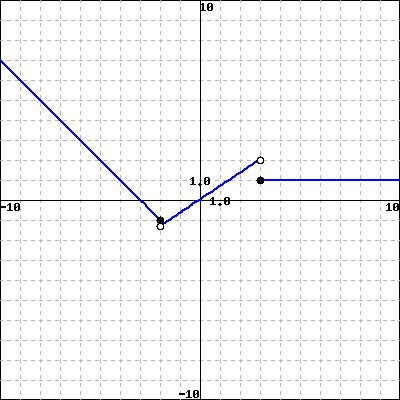
is to look at the restrictions given by each piece of the function. This information will tell us about open and closed circles on the graph and where those should occur.
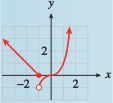
It may be good to pick out an equation in the piecewise function that is easily identifiable on a graph (if possible). In this case, we have the equation that \(f(x)=1\) for \(x>3\text{.}\) This is a horizontal line on the graph. Find the graph(s) which have the horizontal line in the right place.
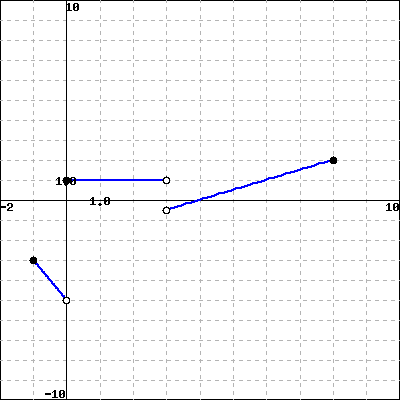
Find a formula for the piecewise function graphed in the figure. Assume the entire graph of \(f(x)\) is shown in the graph. end. (a) The formula for the left piece of \(f(x)\) is \(f(x) =\) for all \(x\) that satisfy the inequality (b) The formula for the middle piece of \(f(x)\) is \(f(x) =\) for all \(x\) that satisfy the inequality (c) The formula for the right piece of \(f(x)\) is \(f(x) =\) for all \(x\) that satisfy the inequality
a) We can find the equation of the left piece of the graph by finding the linear function between the points \((-1,-3)\) and \((0,-5)\text{.}\) Recall the slope formula
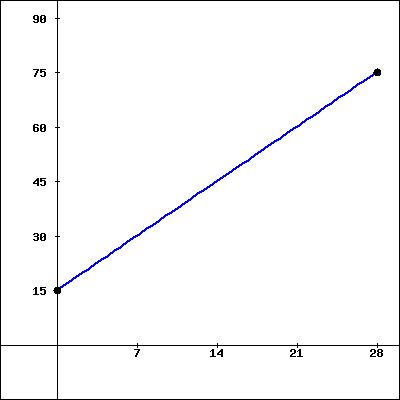
Fred has a piggy bank. On his twelfth birthday, he started saving money. Every week, on the first day of the week, he puts half of his $ 30 allowance into the bank. Write a formula for \(f(t)\text{,}\) the amount of money in his piggy bank \(t\) days after his twelfth birthday, on the domain \(0 \leq t \leq 28\text{.}\) You may assume that Fred’s first deposit was made on his birthday, i.e. on day \(t=0\text{,}\) which is on the first day of the week.
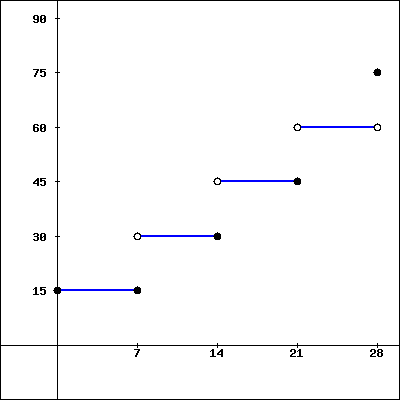
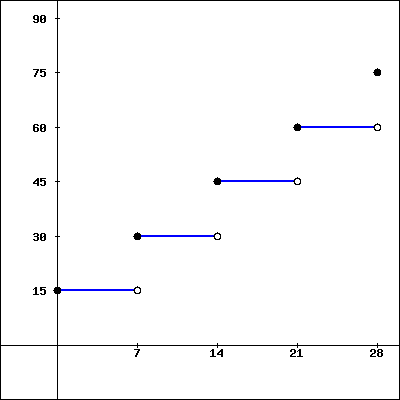
It’s important to note that Fred deposits 15 dollars into his piggy bank every week on the same day. Therefore, between deposits, his piggy bank value (i.e., the value of \(f(t)\)) stays constant.
a) To fill in the table, we should start with 15 dollars on \(t=0\text{.}\) The value of \(f(t)\) should increase on every multiple of 7, because that’s the day he deposits another 15 dollars into his piggy bank.
b) To choose the right graph, we can use our table as a guide. Since the piggy bank value is constant between deposits, we should be looking for horizontal lines on values that represent non-deposit days of the week. Be sure to check specific points to determine the correct graph.
An art professor wishes to take his class on a trip to the Art Institute of Chicago. The Art Institute has several different pricing options for groups:
For groups of at least 15 people, the group must also book their tickets ahead of time, and pay a flat reservation fee of $ 20. For groups of size 14 people or fewer, there is no reservation fee.
a) Fill in the missing values of the table showing the cost of admittance, \(C(n)\) for a group of \(n\) people, for \(n\) from 0 to 30, in increments of 5 people.
b) To write the piecewise function \(C(n)\text{,}\) we will essentially translate the above statements into mathematical equations. This will consist of linear functions in each slot.
c) To find how much it costs for the teacher plus 16 students, we will plug in \(n=17\) to our function \(C(n)\text{.}\) You’ll need to determine which equation to use by looking at the restrictions of the function pieces.
d) Finally, to find out how many people the teacher can take, in addition to himself, with the budget 192 dollars, we need to use each equation of \(C(n)\) until we find an answer in the right domain. In other words, we will set each piece of the function equal to 192 and choose the appropriate answer from there.
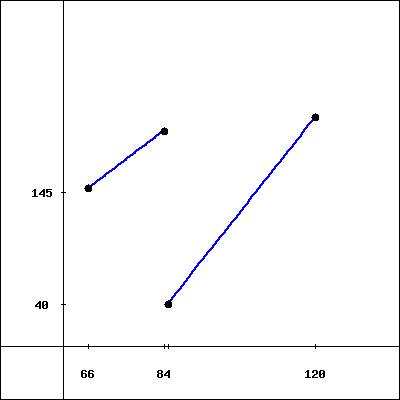
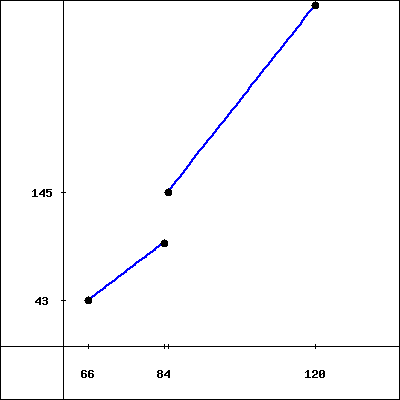
A section of highway has a 65 mph speed limit. If you are caught speeding between 66 and 84 mph, your fine is $ 40 plus $3 for every mile over 65 mph. For 85 mph and higher, your fine is $ 145 plus $5 for every mile per hour over 85. For this problem, assume your car can reach a maximum speed of 120 mph (although we don’t encourage you to drive that fast.)
e) What are the domain and range in the graph of the cost function from part b)? Remember we are assuming your car can reach a maximum speed of 120 mph.
d) One way to determine which graph represents the situation, we can find the ordered pairs associated with some of the relevant information in the problem. In particular, it is useful to find the ordered pairs associated with \(s=66\text{,}\)\(s=84\text{,}\)\(s=85\) and \(s=120\text{.}\)
The graph we want has these ordered pairs with linear functions connecting the first two and the second two. Notice that we don’t really consider what happens if you are driving between 84 mph and 85 mph because we are only considering whole number values.