Section 1.4 Rates of Change

Subsection 1.4.1 Increasing and Decreasing

Most people have intuition about what is means for something to be increasing and what it means for something to be decreasing. However, we need to develop a solid mathematical way of defining increasing and decreasing.
Before defining increasing and decreasing is will be useful to recall interval notation.
An interval is a set that consists of all the real numbers between two numbers \(a\) and \(b\text{.}\)
The set \(-2 \le x \le 2\) includes its endpoints \(-2\) and \(2\text{,}\) so we call it a closed interval , and we denote it by \([-2, 2]\) (see Figure 1.77a). The square brackets tell us that the endpoints are included in the interval. An interval that does not include its endpoints, such as \(-2 \lt x \lt 2\text{,}\) is called an open interval , and we denote it with round brackets, \((-2, 2)\) (see Figure 1.77b).
described in detail following the image
closed interval and open interval
Figure 1.77.

Caution 1.78.

Do not confuse the open interval \((-2, 2)\) with the point \((-2, 2)\text{!}\) The notation is the same, so you must decide from the context whether an interval or a point is being discussed.
We can also discuss infinite intervals , such as \(x\lt 3\) and \(x\ge -1\text{,}\) shown in Figure 1.79. We denote the interval \(x\lt 3\) by \((-\infty, 3)\text{,}\) and the interval \(x\ge -1\) by \([-1, \infty)\text{.}\) The symbol \(\infty\text{,}\) for infinity, does not represent a specific real number but rather indicates that the interval continues forever along the real line. Because of this, we will always use a round bracket along side \(\pm \infty\text{.}\)
described in detail following the image
infinite intervals
Figure 1.79.
Some intervals are closed on one end and open on the other. We call such an interval a half-open or half-closed interval. Some examples of half-open/half-closed intervals are \([-2,9)\) and \((0,23]\text{.}\)
Finally, we can combine two or more intervals into a larger set. For example, the set consisting of \(x\lt -1\) or \(x\gt 2\text{,}\) shown in Figure 1.80, is the union of two intervals and is denoted by \((-\infty,-2) \cup (2,\infty)\text{.}\)
described in detail following the image
number line with two disjoint infinite intervals
Figure 1.80.
Many solutions of inequalities are intervals or unions of intervals.

Example 1.81.

Write each of the solution sets with interval notation and graph the solution set on a number line.
  1. \(\displaystyle 3 \le x \lt 6\)
  2. \(\displaystyle x \ge -9\)
  3. \(\displaystyle x\le 1 ~\text{ or }~ x\gt 4\)
  4. \(\displaystyle -8 \lt x \le -5 ~\text{ or }~ -1 \le x \lt 3\)
Solution.
  1. \([3, 6)\text{.}\) (See Figure 1.82.)
    described in detail following the image
    half-open interval
    Figure 1.82.
  2. \([-9,\infty)\text{.}\) We always use round brackets next to the symbol \(\infty\) because \(\infty\) is not a specific number and is not included in the set. (See Figure 1.83.)
    described in detail following the image
    half-closed infinite interval
    Figure 1.83.
  3. \((-\infty, 1] \cup (4, \infty)\text{.}\) The word or describes the union of two sets. (See Figure 1.84.)
    described in detail following the image
    disjoint infinite intervals
    Figure 1.84.
  4. \((-8,-5] \cup [-1, 3)\text{.}\) (See Figure 1.85.)
    described in detail following the image
    disjoint finite intervals
    Figure 1.85.
Now that we have reviewed interval notation we are positioned to define increasing and decreasing functions

Definition of Increasing and Decreasing.

Let \(y = f(x)\) where \(a\leq x \leq b.\)
Then the function \(f(x)\) is said to be increasing on \((a,b)\) if the value of \(f(x)\) increases as \(x\) increases on \((a,b)\text{.}\)
Then the function \(f(x)\) is said to be decreasing on \((a,b)\) if the value of \(f(x)\) decreases as \(x\) increases on \((a,b)\text{.}\)

Caution 1.86.

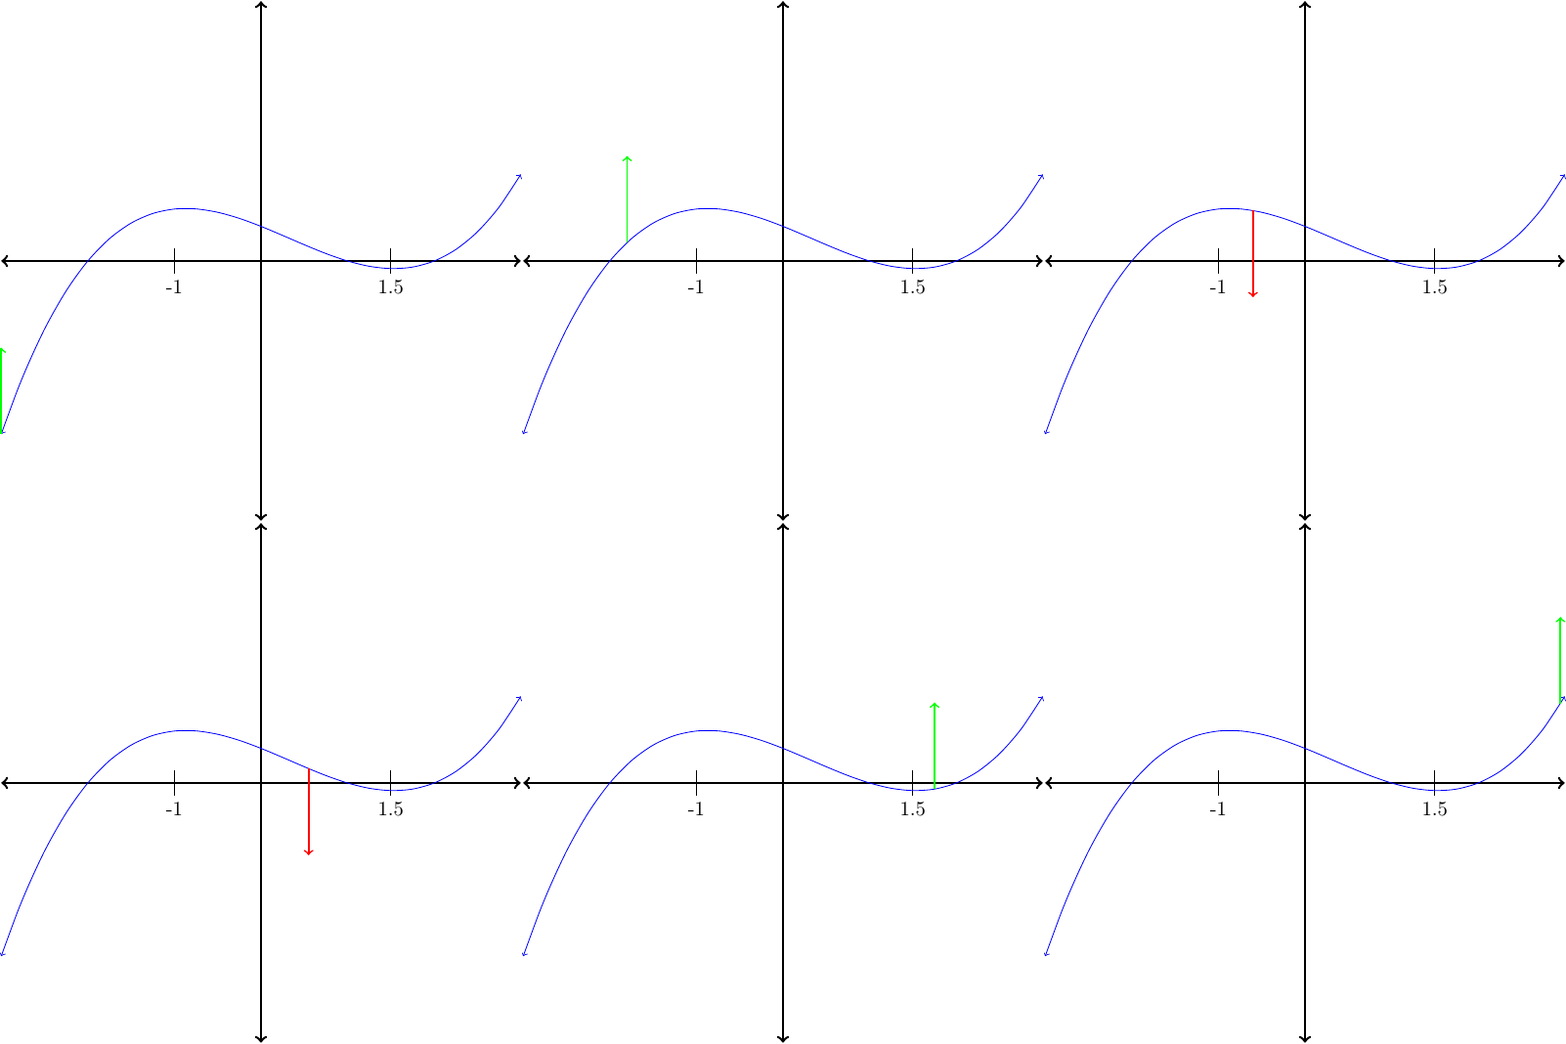
If the graph of a function has arrows on the ends then we can assume that the function continues in that same general direction.

Example 1.87.

Subsection 1.4.2 Measuring Steepness

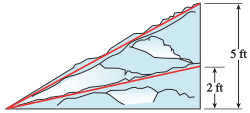
Imagine you are an ant carrying a heavy burden along one of the two paths shown in Figure 1.89. Which path is more difficult? Most ants would agree that the steeper path is more difficult.
But what exactly is steepness? It is not merely the gain in altitude, because even a gentle incline will reach a great height eventually. Steepness measures how sharply the altitude increases. An ant finds the second path more difficult, or steeper, because it rises 5 feet while the first path rises only 2 feet over the same horizontal distance.
described in detail following the image
ant’s climb
Figure 1.89.
To compare the steepness of two inclined paths, we compute the ratio of change in altitude to change in horizontal distance for each path.

Example 1.90.

Which is steeper, Stony Point trail, which climbs 400 feet over a horizontal distance of 2500 feet, or Lone Pine trail, which climbs 360 feet over a horizontal distance of 1800 feet?
Solution.
For each trail, we compute the ratio of vertical gain to horizontal distance. For Stony Point trail, the ratio is
\begin{equation*} \frac{400 \text{ feet}}{2500 \text{ feet}}= 0.16 \end{equation*}
and for Lone Pine trail, the ratio is
\begin{equation*} \frac{360 \text{ feet}}{1800 \text{ feet}}= 0.20. \end{equation*}
Lone Pine trail is steeper, because it has a vertical gain of 0.20 foot for every foot traveled horizontally. Or, in more practical units, Lone Pine trail rises 20 feet for every 100 feet of horizontal distance, whereas Stony Point trail rises only 16 feet over a horizontal distance of 100 feet.

Subsection 1.4.3 Definition of Slope

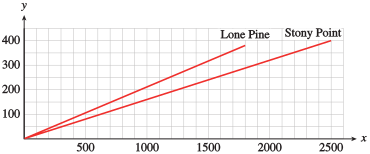
To compare the steepness of the two trails in Example 1.90, it is not enough to know which trail has the greater gain in elevation overall. Instead, we compare their elevation gains over the same horizontal distance. Using the same horizontal distance provides a basis for comparison. The two trails are illustrated in Figure 1.91 as lines on a coordinate grid.
described in detail following the image
trails on grid
Figure 1.91.
The ratio we computed in Example 1.90,
\begin{equation*} \frac{\text{change in elevation}}{\text{change in horizontal position}} \end{equation*}
appears on the graphs in Figure 1.91 as
\begin{equation*} \frac{\text{change in }y\text{-coordinate}}{\text{change in }x\text{-coordinate}} \end{equation*}
For example, as we travel along the line representing Stony Point trail, we move from the point \((0, 0)\) to the point \((2500, 400)\text{.}\) The \(y\)-coordinate changes by \(400\) and the \(x\)-coordinate changes by \(2500\text{,}\) giving the ratio \(0.16\) that we found in Example 1.90. We call this ratio the slope of the line.

Definition of Slope.

The slope of a line is the ratio
\begin{equation*} \frac{\text{change in }y\text{-coordinate}}{\text{change in }x\text{-coordinate}} \end{equation*}
as we move from one point to another on the line.

Example 1.92.

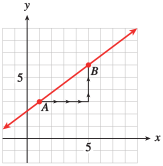
Compute the slope of the line that passes through points \(A\) and \(B\) in Figure 1.93.
described in detail following the image
points on line
Figure 1.93.
Solution.
As we move along the line from \(A\) to \(B\text{,}\) the \(y\)-coordinate changes by \(3\) units, and the \(x\)-coordinate changes by \(4\) units. The slope of the line is thus
\begin{equation*} \frac{\text{change in }y\text{-coordinate}}{\text{change in }x\text{-coordinate}}=\frac{3}{4} \end{equation*}

Example 1.94.

Compute the slope of the line through the indicated points in Figure 1.95. On both axes, one square represents one unit.
\begin{equation*} \frac{\text{change in }y\text{-coordinate}}{\text{change in }x\text{-coordinate}}= \end{equation*}
described in detail following the image
line on grid
Figure 1.95.
Solution.
\(m=\dfrac{2}{8}=\dfrac{1}{4} \)
The slope of a line is a number. It tells us how much the \(y\)-coordinates of points on the line increase when we increase their \(x\)-coordinates by 1 unit. For instance, the slope \(\dfrac{3}{4}\) in Example 1.92 means that the \(y\)-coordinate increases by \(\dfrac{3}{4}\) unit when the \(x\)-coordinate increases by 1 unit. For increasing graphs, a larger slope indicates a greater increase in altitude, and hence a steeper line.

Subsection 1.4.4 Notation for Slope

We use a shorthand notation for the ratio that defines slope,
\begin{equation*} \frac{\text{change in }y\text{-coordinate}}{\text{change in }x\text{-coordinate}}. \end{equation*}
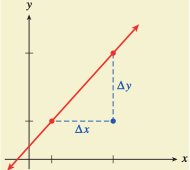
The symbol \(\Delta\) (the Greek letter delta) is used in mathematics to denote change in. In particular, \(\Delta y\) means change in \(y\)-coordinate, and \(\Delta x\) means change in \(x\)-coordinate. We also use the letter \(m\) to stand for slope. With these symbols, we can write the definition of slope as follows.

Notation for Slope.

The slope of a line is given by
\begin{equation*} \frac{\Delta y}{\Delta x}=\frac{\text{change in }y\text{-coordinate}}{\text{change in }x\text{-coordinate}}\text{, }~\Delta x\ne 0. \end{equation*}
described in detail following the image
slope of line

Example 1.96.

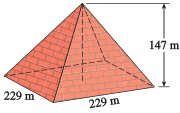
The Great Pyramid of Khufu in Egypt was built around 2550 B.C. It is 147 meters tall and has a square base 229 meters on each side. Calculate the slope of the sides of the pyramid, rounded to two decimal places.
Solution.
From Figure 1.97, we see that \(\Delta x\) is only half the base of the Great Pyramid, so
\begin{equation*} \Delta x = 0.5(229) = 114.5 \end{equation*}
and the slope of the side is
\begin{equation*} m=\frac{\Delta y}{\Delta x}= \frac{147}{114.5} = 1.28 \end{equation*}
described in detail following the image
Great Pyramid of Khufu
Figure 1.97.

Example 1.98.

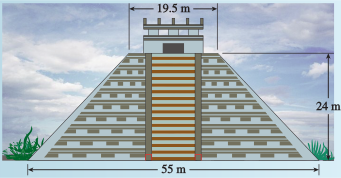
The Kukulcan Pyramid at Chichen Itza in Mexico was built around 800 A.D. It is \(24\) meters high, with a temple built on its top platform, as shown in Figure 1.99.
The square base is \(55\) meters on each side, and the top platform is \(19.5\) meters on each side. Calculate the slope of the sides of the pyramid. Which pyramid is steeper, Kukulcan or the Great Pyramid?
described in detail following the image
Kukulcan Pyramid of Chichen Itza
Figure 1.99.
Solution.
The slope of the sides of the Kukulcan Pyramid is \(\frac{24}{17.5}\text{,}\) which is approximately \(1.35\text{;}\) Kukulcan is steeper.
So far, we have only considered examples in which \(\Delta x\) and \(\Delta y\) are positive numbers, but they can also be negative.
\begin{equation*} \Delta x = \begin{cases} \text{positive if } x \text{ increases (move to the right)}\\ \text{negative if } x \text{ decreases (move to the left)}\\ \end{cases} \end{equation*}
\begin{equation*} \Delta y = \begin{cases} \text{positive if } y \text{ increases (move up)}\\ \text{negative if } y \text{ decreases (move down)}~~~~~~~~~\\ \end{cases} \end{equation*}

Example 1.100.

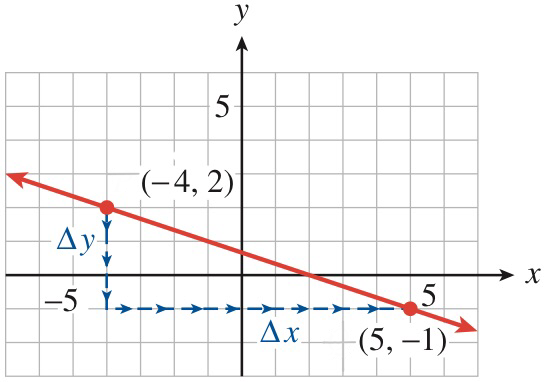
Compute the slope of the line that passes through the points \((-4, 2)\) and \((5, -1)\) shown in Figure 1.101 Illustrate \(\Delta y\) and \(\Delta x\) on the graph.
described in detail following the image
negative slope
Figure 1.101.
Solution.
As we move from the point \((-4, 2)\) to the point \((5, -1)\text{,}\) we move \(3\) units down, so \(\Delta y = -3\text{.}\) We then move \(9\) units to the right, so \(\Delta x = 9\text{.}\) Thus, the slope is
\begin{equation*} m = \frac{\Delta y}{\Delta x}=\frac{-3}{9}=\frac{-1}{3} \end{equation*}
\(\Delta y\) and \(\Delta x\) are labeled on the graph.
We can move from point to point in either direction to compute the slope. The line graphed in Example 1.100 decreases as we move from left to right and hence has a negative slope.
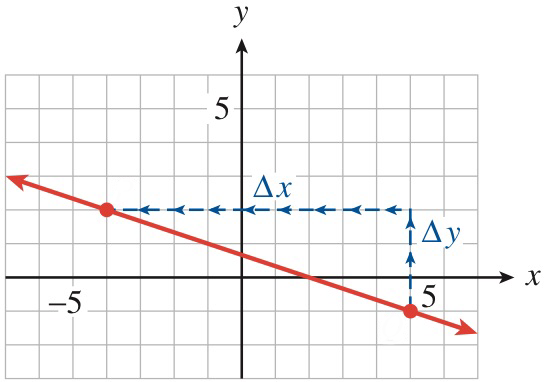
The slope is the same if we move from point \((5,-1)\) to point \((-4,2)\) instead of from \((-4,2)\) to \((5,-1)\text{.}\) (See Figure 1.102.) In that case, our computation looks like this:
\begin{equation*} m = \frac{\Delta y}{\Delta x}=\frac{3}{-9}=\frac{-1}{3} \end{equation*}
\(\Delta y\) and \(\Delta x\) are labeled on the graph.
described in detail following the image
negative slope
Figure 1.102.

Subsection 1.4.5 Lines Have Constant Slope

How do we know which two points to choose when we want to compute the slope of a line? It turns out that any two points on the line will do.

Example 1.103.

Note 1.104.

Example 1.103 illustrates an important property of lines: They have constant slope. No matter which two points we use to calculate the slope, we will always get the same result. We will see later that lines are the only graphs that have this property.
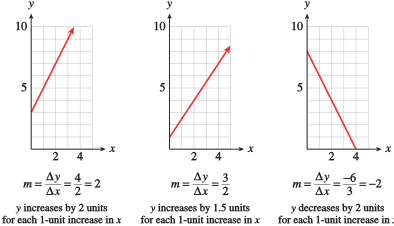
We can think of the slope as a scale factor that tells us how many units \(y\) increases (or decreases) for each unit of increase in \(x\text{.}\) Compare the lines in Figure 1.105
described in detail following the image
slopes
Figure 1.105.
Observe that a line with positive slope increases from left to right, and one with negative slope decreases. What sort of line has slope \(m = 0\text{?}\)

Subsection 1.4.6 Meaning of Slope

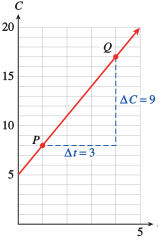
Consider the graph of the equation \(C = 5 + 3t\) showing the cost of a bicycle rental in terms of the length of the rental. Figure 1.106 We can choose any two points on the line to compute its slope. Using points \(P\) and \(Q\) as shown, we find that
\begin{equation*} m = \frac{\Delta C}{\Delta t}= \frac{9}{3}=3 \end{equation*}
The slope of the line is \(3\text{.}\)
described in detail following the image
meaning of slope
Figure 1.106.
What does this value mean for the cost of renting a bicycle? The expression
\begin{equation*} \frac{\Delta C}{\Delta t}= \frac{9}{3} \end{equation*}
stands for
\begin{equation*} \frac{\text{change in cost}}{\text{change in time}}= \frac{9 \text{ dollars }}{3 \text{ hours}}. \end{equation*}
If we increase the length of the rental by 3 hours, the cost of the rental increases by 9 dollars. The slope gives the rate of increase in the rental fee, 3 dollars per hour. In general, we can make the following statement.

Rate of Change.

The slope of a line measures the rate of change of the output variable with respect to the input variable.
Depending on the variables involved, this rate might be interpreted as a rate of growth or a rate of speed. A negative slope might represent a rate of decrease or a rate of consumption. The slope of a graph can give us valuable information about the variables.

Example 1.107.

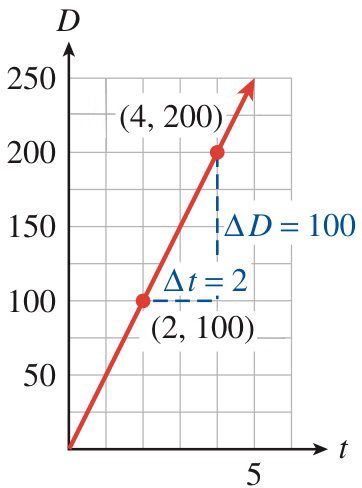
The graph in Figure 1.108 shows the distance in miles traveled by a big-rig truck driver after \(t\) hours on the road.
  1. Compute the slope of the graph.
  2. What does the slope tell us about the problem?
described in detail following the image
Figure 1.108.
Solution.
  1. Choose any two points on the line, say \((2, 100)\) and \((4, 200)\text{,}\) in Figure 1.108. As we move from \((2,100)\) to \((4,200)\text{,}\) we find
    \begin{equation*} m = \frac{\Delta D}{\Delta t}=\frac{100}{2}=50 \end{equation*}
    The slope of the line is 50.
  2. The best way to understand the slope is to include units in the calculation. For our example,
    \begin{equation*} \frac{\Delta D}{\Delta t}= \frac{\text{change in distance}}{\text{change in time}}. \end{equation*}
    More specifically,
    \begin{equation*} \frac{\Delta D}{\Delta t} =\frac{100 \text{ miles}}{2\text{ hours}} =50 \text{ miles per hour}. \end{equation*}
    The slope represents the trucker’s average speed.

Example 1.109.

Subsection 1.4.7 A Formula for Slope

We have defined the slope of a line to be the ratio \(m = \dfrac{\Delta y}{\Delta x}\) as we move from one point to another on the line. So far, we have computed \(\Delta y\) and \(\Delta x\) by counting squares on the graph, but this method is not always practical. All we really need are the coordinates of two points on the graph.
We will use subscripts to distinguish the two points: let \((x_1, y_1)\) be the coordinates of the first points and let \((x_2, y_2)\) be the coordinates of the second point.
described in detail following the image
slope of line
Figure 1.111.
Now consider a specific example. The line through the two points \((2, 9)\) and \((7,-6)\) is shown in Figure 1.111. We can find \(\Delta x\) by subtracting the \(x\)-coordinates of the points:
\begin{equation*} \Delta x = 7 - 2 = 5 \end{equation*}
In general, we have
\begin{equation*} \Delta x = x_2 - x_1 \end{equation*}
and similarly
\begin{equation*} \Delta y = y_2 - y_1 . \end{equation*}
These formulas work even if some of the coordinates are negative; in our example,
\begin{equation*} \Delta y = y_2 - y_1 = -6 - 9 = -15. \end{equation*}
By counting squares down from \((2,9)\) to \((7,-6)\text{,}\) we see that \(\Delta y\) is indeed \(-15\text{.}\) The slope of the line in Figure 1.111 is
\begin{align*} m\amp=\frac{\Delta y}{\Delta x}=\frac{y_2 - y_1}{x_2 - x_1}\\ \amp=\frac{-15}{5} = -3. \end{align*}
We now have a formula for the slope of a line that works even if we do not have a graph.

Two-Point Slope Formula.

The slope of the line passing through the points \((x_1, y_1)\) and \((x_2, y_2)\) is given by
\begin{equation*} m = \frac{\Delta y}{\Delta x}= \frac{y_2 - y_1}{x_2 - x_1} \text{, }~x_2 \ne x_1. \end{equation*}

Example 1.112.

Compute the slope of the line in Figure 1.111 using the points \((6, -3)\) and \((4, 3)\text{.}\)
Solution.
Substitute the coordinates of \((6, -3)\) and \((4, 3)\) into the slope formula to find
\begin{equation*} m = \frac{y_2 - y_1}{x_2 - x_1}= \frac{3 - (-3)}{4 - 6} = \frac{6}{-2}= -3. \end{equation*}
This value for the slope, \(-3\text{,}\) is the same value found above.

Example 1.113.

It will also be useful to write the slope formula with function notation. Recall that \(f (x)\) is another symbol for \(y\text{,}\) and, in particular, that \(y_1 = f (x_1)\) and \(y_2 = f (x_2)\text{.}\) Thus, if \(x_2 \ne x_1\text{,}\) we have

Slope Formula in Function Notation.

\begin{equation*} m = \frac{\Delta y}{\Delta x} = \frac{y_2 - y_1}{x_2 - x_1} = \frac{f(x_2) - f(x_1)}{x_2 - x_1} \text{, }~x_2 \ne x_1 \end{equation*}

Example 1.114.

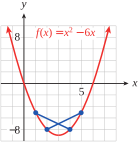
Figure 1.115 shows a graph of
\begin{equation*} f (x) = x^2 - 6x. \end{equation*}
  1. Compute the slope of the line segment joining the points at \(x = 1\) and \(x = 4\text{.}\)
  2. Compute the slope of the line segment joining the points at \(x = 2\) and \(x = 5\text{.}\)
described in detail following the image
slopes on parabola
Figure 1.115.
Solution.
  1. We set \(x_1 = \alert{1}\) and \(x_2 = \alert{4}\) and find the function values at each point.
    \begin{equation*} f (x_1) = f (\alert{1}) = \alert{1}^2 - 6(\alert{1}) = -5 \end{equation*}
    \begin{equation*} f (x_2) = f (\alert{4}) = \alert{4}^2 - 6(\alert{4}) = -8 \end{equation*}
    Then
    \begin{equation*} m = \frac{f (x_2) - f (x_1)}{x_2 - x_1} =\frac{-8 - (-5)}{4 - 1}=\frac{-3}{3}= -1. \end{equation*}
  2. We set \(x_1 = \alert{2}\) and \(x_2 = \alert{5}\) and find the function values at each point.
    \begin{equation*} f (x_1) = f (\alert{2}) = \alert{2}^2 - 6(\alert{2}) = -8 \end{equation*}
    \begin{equation*} f (x_2) = f (\alert{5}) = \alert{5}^2 - 6(\alert{5}) = -5 \end{equation*}
    Then
    \begin{equation*} m = \frac{f (x_2) - f (x_1)}{x_2 - x_1} =\frac{-5 - (-8)}{5 - 2}=\frac{3}{3}= 1. \end{equation*}
Note that the graph of \(f\) is not a straight line and that the slope is not constant.

Example 1.116.

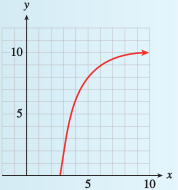
Figure 1.117 shows the graph of a function \(f\text{.}\)
  1. Find \(f (3)\) and \(f (5)\text{.}\)
  2. Compute the slope of the line segment joining the points at \(x = 3\) and \(x = 5\text{.}\)
  3. Write an expression for the slope of the line segment joining the points at \(x = a\) and \(x = b\text{.}\)
described in detail following the image
increasing curve
Figure 1.117.
Solution.
  1. \(\displaystyle f (3) = 2, ~f (5) = 8\)
  2. \(\displaystyle m=\dfrac{8-2}{5-3}=3\)
  3. \(\displaystyle \dfrac{f(b)-f(a)}{b-a} \)

Exercises 1.4.8 Exercises

1. The Average Rate of Change.

a) Compute the average rate of change for \(g(x) = \frac{1}{x}\) on the following intervals:
i) \(2 \leq x \leq 5\)
ii) \([-6,-4]\)
b) Compute the average rate of change for \(f(x) = 4x-10\) on the following intervals:
i) from \(x=2\) to \(x= 5\)
ii) \([-6,-4]\)
Hint.
To answer all of these questions, we need to use the average rate of change formula for a function \(f(x)\) on an interval \([a,b]\text{:}\)
\begin{equation*} \frac{f(b)-f(a)}{b-a}. \end{equation*}
a) We have \(g(x)=\frac{1}{x}\text{,}\) \(a=2\text{,}\) and \(b=5\text{.}\)
b) We have \(g(x)=\frac{1}{x}\text{,}\) \(a=-6\text{,}\) and \(b=-4\text{.}\)
c) We have \(f(x)=4x-10\text{,}\) \(a=2\text{,}\) and \(b=5\text{.}\)
d) We have \(f(x)=4x-10\text{,}\) \(a=-6\text{,}\) and \(b=-4\text{.}\)

2. Applied Average Rate of Change.

Steve goes on a road trip. He travels a total of 555 miles, and the trip takes 15 hours from start to finish.
What is his average rate of change of distance? Please include in your answer.
Hint.
Steve’s initial position is 0 miles from the starting place at time 0 hours and he arrives at his destination after travelling 495 miles over 15 hours. You can break this down to use the average rate of change formula with ordered pairs \((0,0)\) and \((555,15)\text{.}\)
Since we are taking a distance in miles divided by a time in hours, think about what this would mean for the units.

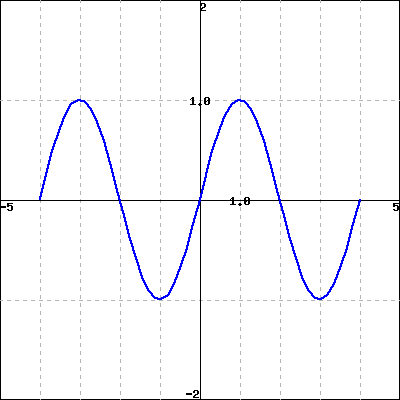
3. Increasing and Decreasing on Intervals.

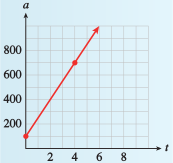
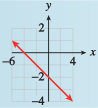
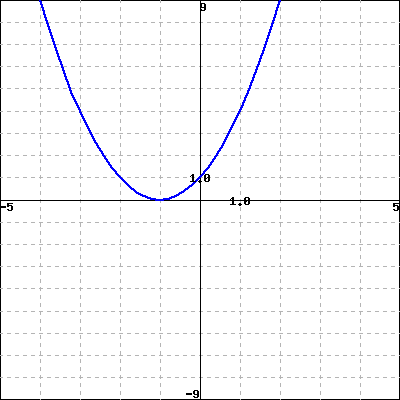
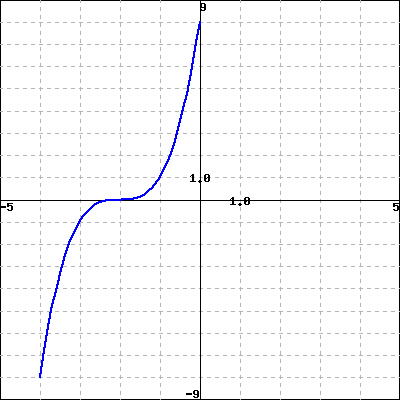
For the following functions, determine on what intervals the function is increasing and on what intervals the function is decreasing. Assume the entire function is shown in the provided graph. Give answers as open intervals, and if no interval exists, type the word NONE in the associated blank.
Increasing:
Decreasing:
Increasing:
Decreasing:
Increasing:
Decreasing:
Hint.
To determine the intervals on which a function is increasing, we want to look at intervals where the function is going up as you move left to right. To determine the intervals on which a function is decreasing, we want to look at intervals where the function is going down as you move left to right.
a) The function is going down from \(x=-4\) to \(x=-1\) and going up from \(x=-1\) to \(x=2\text{.}\)
b) The function is always going up.
c) The function changes from increasing to decreasing several times, so our answer will include unions of intervals. We see that the function is increasing from \(x=-4\) to \(x=-3\text{,}\) from \(x=-1\) to \(x=1\text{,}\) and from \(x=3\) to \(x=4\text{.}\)
We see that the function is decreasing from \(x=-3\) to \(x=-1\) and from \(x=1\) to \(x=3\text{.}\)

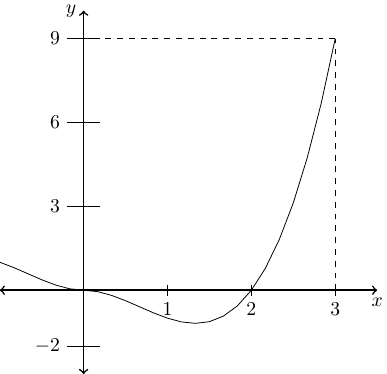
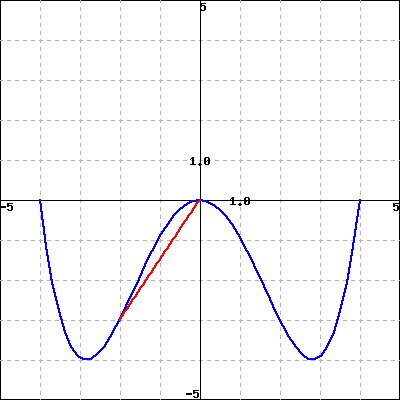
4. Average Rate of Change From a Graph.

A graph of \(g(x)\) is shown below. Compute the average rate of change of \(g(x)\) on the interval \([0,3]\text{.}\)
Average rate of change on the interval \([0,3]\text{:}\)
Hint.
The average rate of change of \(g(x)\) on the interval \([0,3]\) is given by
\begin{equation*} \frac{g(3)-g(0)}{3-0} \end{equation*}
Use the graph to find the values of \(g(3)\) and \(g(0)\text{.}\)

5. The Average Rate of Change Formula.

Consider the function Below is the graph of \(g(x)\) on the axes below. Note: Be sure to decide on an appropriate scale and then clearly indicate that scale on your graph.
a) Evaluate each of the following.
(i)\(\dfrac{g(0)-g(-2)}{0-(-2)}\)
(ii) \(\dfrac{g(-2)-g(-4)}{-2-(-4)}\)
(iii) \(\dfrac{g(0)-g(-4)}{0-(-4)}\)
b) Interpret each as the average rate of change of \(g(x)\) over some interval.
(i) \(\dfrac{g(0)-g(-2)}{0-(-2)}\) is the average rate of change of \(g(x)\) over the interval
(ii) \(\dfrac{g(-2)-g(-4)}{-2-(-4)}\) is the average rate of change of \(g(x)\) over the interval
(iii) \(\dfrac{g(0)-g(-4)}{0-(-4)}\) is the average rate of change of \(g(x)\) over the interval
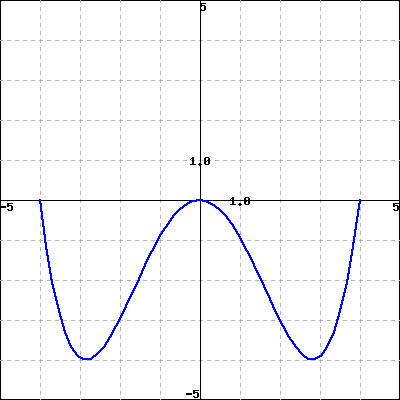
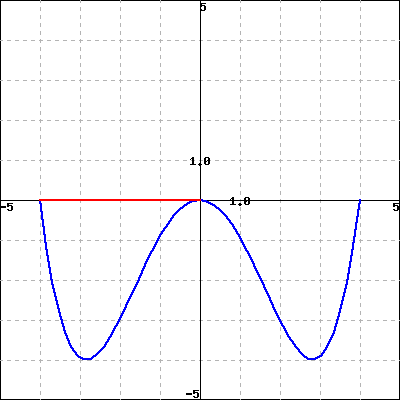
c) For each of the expressions in (i)-(iii) of part (a), choose the graph whose red line has the same slope as the calculated rate of change.
A B C
(Click on a graph to enlarge it)
Hint.
a) Using the graph, we have that \(g(0)=0\text{,}\) \(g(-2)=3\text{,}\) and \(g(-4)=0\text{.}\) We can use this information to evaluate each quotient.
b) The average rate of change of \(g(x)\) on the interval \([a,b]\) is given by
\begin{equation*} \frac{g(b)-g(a)}{b-a}. \end{equation*}
So the interval is given by the values we plug in to \(g(x)\text{.}\) Use this information to determine the values of \(a\) and \(b\) for each part below.
c) We can look at either the interval or the average rate of change to determine which graph represents the situation.
(i) Look for the graph that has a red line of slope 1.5 on the interval \([-2,0]\text{.}\)
(i) Look for the graph that has a red line of slope -1.5 on the interval \([-4,-2]\text{.}\)
(i) Look for the graph that has a red line of slope 0 on the interval \([-4,0]\text{.}\)

6. The Average Rate of Change and Invasive Species.

Yellow star thistle is an invasive plant species; it is a big threat in the Santa Monica Mountains national recreation area. Ecologists have gathered data to model the spreading of the plant. Suppose the land area (in square miles) that has been overtaken by the thistle \(t\) years after 2000 is given by \begin{align*} w(t) = 0.792t^3 - 4.196t^2 + 3.872t + 24.021. \end{align*} Compute the average rate of change of the land inhabited by yellow star thistle over the following intervals of years:
a) 2000 to 2004
b) 2004 to 2008
c) 2008 to 2012
Brainstorm: What does this suggest about the future of the park?
Hint.
Since \(t\) is the number of years since 0, we want to find \(w(0)\text{,}\) \(w(4)\text{,}\) \(w(8)\text{,}\) and \(w(12)\text{:}\)
\(w(0)=24.021\)
\(w(4)=23.061\)
\(w(8)=191.957\)
\(w(12)=834.837\)
We can now find the average rate of change on the appropriate intervals. Recall the average rate of change formula:
\begin{equation*} \frac{w(b)-w(a)}{b-a}. \end{equation*}
You’ll need to use this for each part.
This information might suggest that the park will eventually be taken over completely by the yellow star thistle.

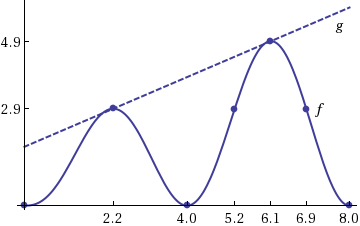
7. The Average Rate of Change and Lines.

Based on the graphs of \(f(x)\) and \(g(x)\) below, answer the following questions. You should not approximate any of your answers.
a) What is the average rate of change of \(f(x)\) over the interval \(\ 2.2 \leq x \leq 8 \ \) ?
b) What is the average rate of change of \(g(x)\) over the interval \(\ 2.2 \leq x \leq 6.1 \ \) ?

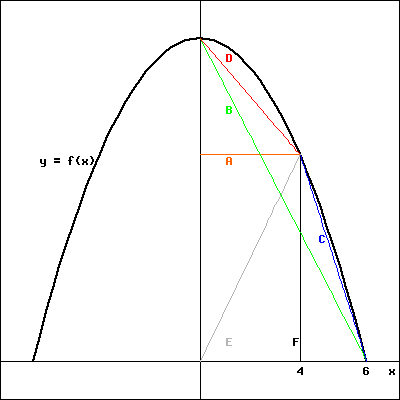
8. The Average Rate of Change and Graphs.

Let \(\ f(x) = 36 - x^2\text{.}\)
a) Compute each of the following expressions and interpret each as an average rate of change:
(i) \(\ \ \ \frac{f( 4 ) - f(0)}{ 4 - 0} = \ \)
(ii) \(\ \ \frac{f( 6 ) - f( 4 )}{6 - 4 } = \ \)
(iii) \(\ \frac{f( 6 ) - f(0)}{6 - 0} = \ \)
b) Based on the graph sketched below, match each of your answers in (i) - (iii) with one of the lines labeled A - F. Type the letter of the line segment next to the corresponding rate of change formula. Notice that not all letters will be used.
(click on image to enlarge)
\(\frac{f( 4 ) - f(0)}{ 4 - 0}\)
\(\frac{f( 6 ) - f( 4 )}{6 - 4 }\)
\(\frac{f( 6 ) - f(0)}{6 - 0}\)