Josh Brummer, Taran Funk, Lawrence Seminario-Romero, Ariel Setniker, Karina Uhing, Nathan Wakefield, Catherine Zimmitti, The Mabel Elizabeth Kelly Fund
The models we have explored so far, namely, linear, exponential, and logarithmic are monotonic functions, that is, always increasing or always decreasing on their domains. (Remember that we used power functions as models in the first quadrant only.) In this chapter, we investigate problems where the output variable may change from increasing to decreasing, or vice versa. The simplest sort of function that models this behavior is a quadratic function, one that involves the square of the variable.
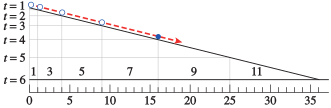
Galileo had no accurate way to measure time; clocks had not been invented yet. So he used water running into a jar to mark equal time intervals. After many trials, Galileo found that the ball traveled \(1\) unit of distance down the plane in the first time interval, \(3\) units in the second time interval, \(5\) units in the third time interval, and so on, as shown in the figure, with the distances increasing through odd units of distance as time went on.
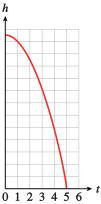
As you can see in Table 6.1, the total distance traveled by the ball is proportional to the square of the time elapsed, \(s = kt^2\text{.}\) Galileo found that this relationship held no matter how steep he made the ramp. Plotting the height of the ball as a function of time, we obtain a portion of the graph of a quadratic function.
Suppose a baseball player pops up, that is, hits the baseball straight up into the air. The height, \(h\text{,}\) of the baseball \(t\) seconds after it leaves the bat can be calculated using a formula from physics. This formula takes into account the initial speed of the ball (\(64\) feet per second) and its height when it was hit (\(4\) feet). The formula for the height of the ball (in feet) is
\begin{equation*}
h = -16t^2 + 64t + 4
\end{equation*}
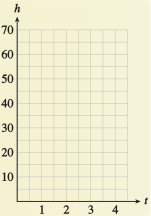
Check that your answer to part (4) corresponds to a point on your graph. Approximate from your graph another time at which the baseball is at the same height as your answer to part (4).
Use your graph to approximate two times when the baseball is at a height of \(20\) feet. Then use the formula to find the actual heights at those times.


 blank grid

