Josh Brummer, Taran Funk, Lawrence Seminario-Romero, Ariel Setniker, Karina Uhing, Nathan Wakefield, Catherine Zimmitti, The Mabel Elizabeth Kelly Fund
We next consider another important family of functions, called exponential functions. These functions describe growth by a constant factor in equal time periods. Exponential functions model many familiar processes, including the growth of populations, compound interest, and radioactive decay. Here is an example.
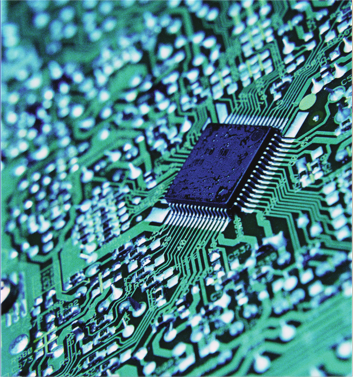
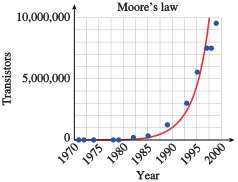
In 1965, Gordon Moore, the cofounder of Intel, observed that the number of transistors on a computer chip had doubled every year since the integrated circuit was invented. Moore predicted that the pace would slow down a bit, but the number of transistors would continue to double every 2 years. More recently, data density has doubled approximately every 18 months, and this is the current definition of Moore’s law. Most experts, including Moore himself, expected Moore’s law to hold for at least another two decades.
Write a function that gives the population of the colony at any time \(t\text{,}\) in days. Hint: Express the values you calculated in part (1) using powers of \(3\text{.}\) Do you see a connection between the value of \(t\) and the exponent on \(3\text{?}\)
Graph your function from part (3) using a calculator. (Use the table to choose an appropriate domain and range.) The graph should resemble your hand-drawn graph from part (2).
Under ideal conditions, the number of rabbits in a certain area can double every \(3\) months. A rancher estimates that \(60\) rabbits live on his land.
Write a function that gives the population of rabbits at any time \(t\text{,}\) in months. Hint: Express the values you calculated in part (1) using powers of \(2\text{.}\) Note that the population of rabbits is multiplied by \(2\) every \(3\) months. If you know the value of \(t\text{,}\) how do you find the corresponding exponent in \(P(t)\text{?}\)
Graph your function from part (3) using a calculator. (Use the table to choose an appropriate domain and range.) The graph should resemble your hand-drawn graph from part (2).
 grid for graph of bacteria population
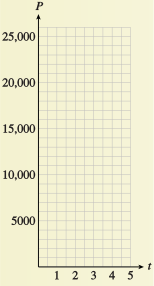
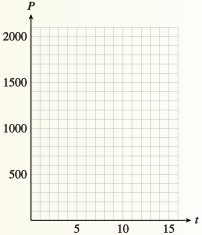 grid for graph of rabbit population

