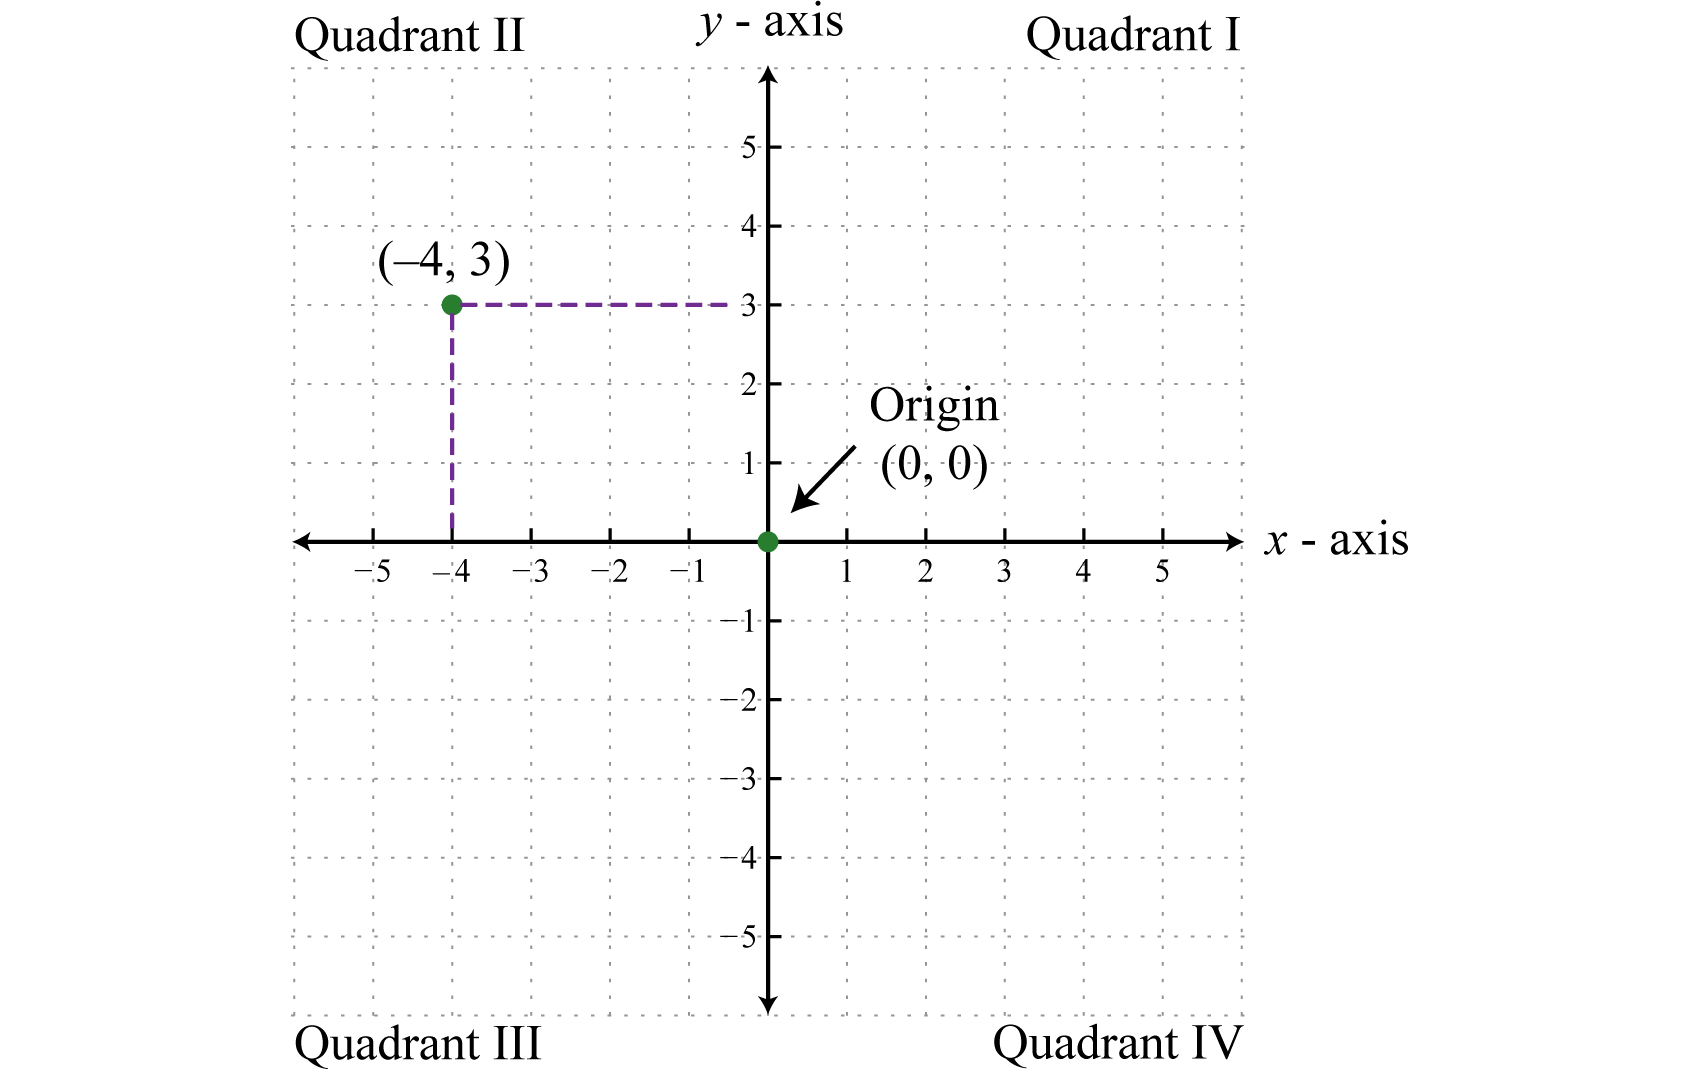
The rectangular coordinate system consists of two real number lines that intersect at a right angle. The horizontal number line is called the \(x\)-axis, and the vertical number line is called the \(y\)-axis. These two number lines define a flat surface called a plane, and each point on this plane is associated with an ordered pair of real numbers \((x, y)\text{.}\) The first number is called the \(x\)-coordinate, and the second number is called the \(y\)-coordinate. The intersection of the two axes is known as the origin, which corresponds to the point \((0, 0)\text{.}\)
The \(x\)- and \(y\)-axes break the plane into four regions called quadrants, named using Roman numerals I, II, III, and IV, as pictured. The ordered pair \((x, y)\) represents the position of points relative to the origin. For example, the ordered pair \((-4, 3)\) represents the position \(4\) units to the left of the origin, and \(3\) units above in the second quadrant.
Next, we define a relation as any set of ordered pairs, graphs, correspondences, tables, or equations. In the context of algebra, the relations of interest are sets of ordered pairs \((x, y)\) in the rectangular coordinate plane. Typically, the coordinates are related by a rule expressed using an algebraic equation (but can also be related via tables, graphs, or diagrams).
For example, consider the absolute value function, denoted \(|a|\text{.}\) This function takes an input \(a\) and tells us its distance from zero. For instance, \(|5|=5\text{,}\) \(|-7|=7\text{,}\) and \(|-112|=112\text{.}\) Now let's consider the algebraic equations \(y=|x|-2\) and \(x=|y|+1\text{.}\) Both these equations define relationships between \(x\) and \(y\) involving the absolute values. Following are some integers that satisfy both equations:
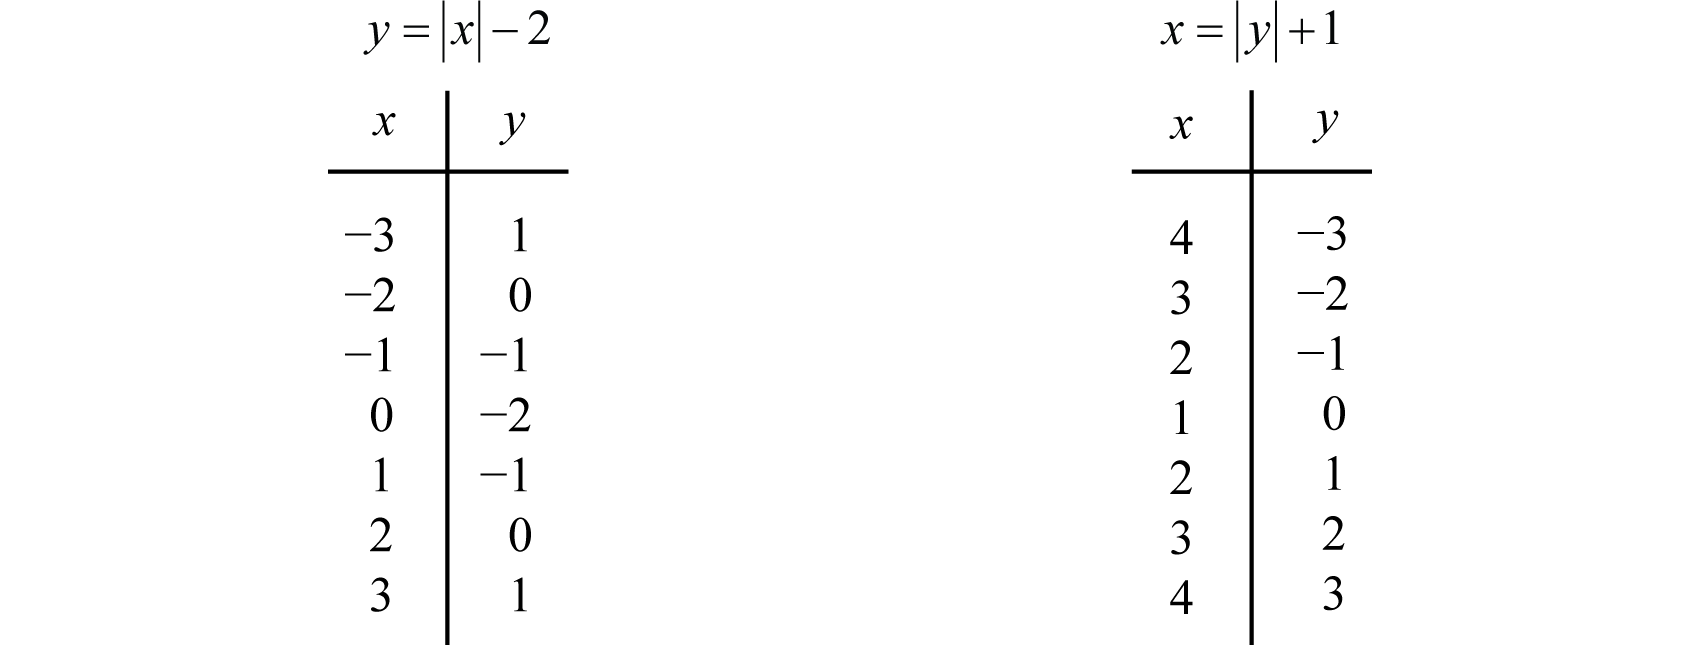
Here two relations consisting of seven ordered pair solutions are obtained:
\begin{align*}
y\amp=|x|-2\text{ has solutions }{(-3,1),(-2,0),(-1,-1),(0,-2),(1,-1),(2,0),(3,1)}\\
x\amp =|y|+1\text{ has solutions }{(4,-3),(3,-2),(2,-1),(1,0),(2,1),(3,2),(4,3)}
\end{align*}
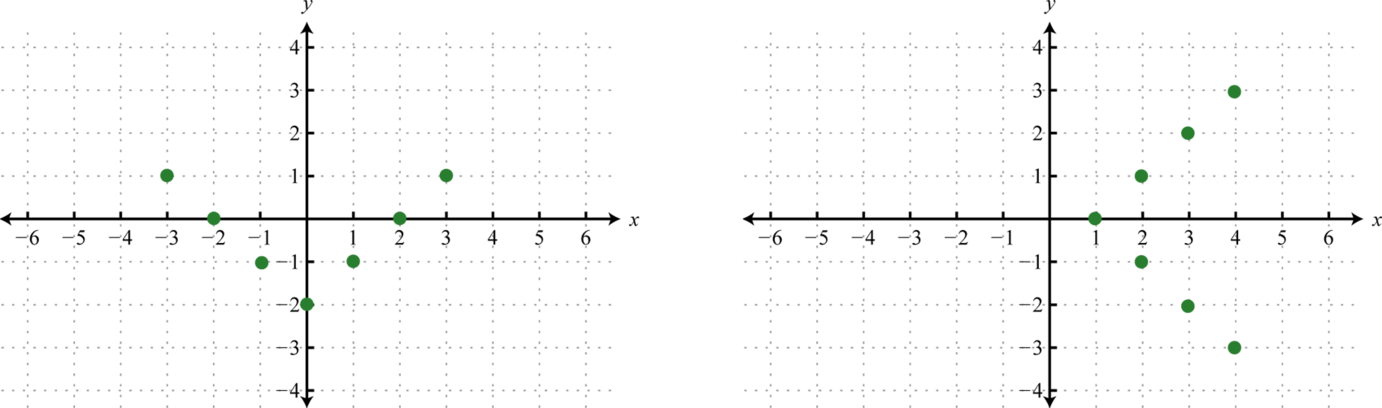
We can visually display any relation of this type on a coordinate plane by plotting the points, or ordered pairs.
The solution sets of each equation will form a relation consisting of infinitely many ordered pairs. We can use the given ordered pair solutions to estimate all of the other ordered pairs by drawing a line through the given points. Here we put an arrow on the ends of our lines to indicate that this set of ordered pairs continues without bounds.
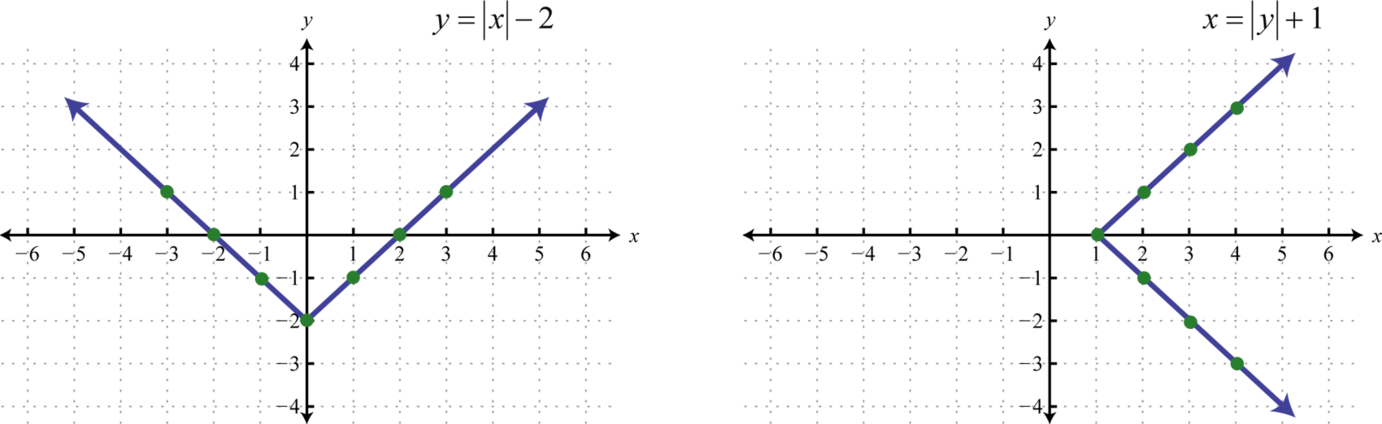
The representation of a relation on a rectangular coordinate plane, as illustrated above, is called a graph. Any curve graphed on a rectangular coordinate plane represents a set of ordered pairs and thus defines a relation.
The set consisting of all of the first components of a relation, in this case the \(x\)-values, is called the domain. And the set consisting of all second components of a relation, in this case the \(y\)-values, is called the range (or codomain). Often, we can determine the domain and range of a relation if we are given its graph.
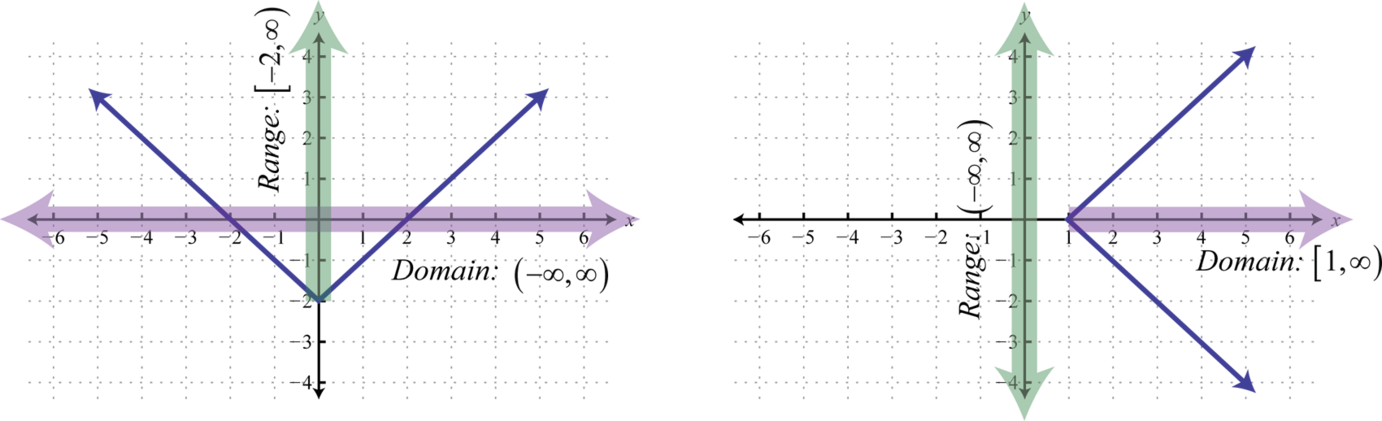
Here we can see that the graph of \(y=|x|-2\) has a domain consisting of all real numbers, \(\mathbb{R}=(-\infty,\infty)\text{,}\) and a range of all \(y\)-values greater than or equal to \(-2\text{,}\) \([-2,\infty)\text{.}\) The domain of the graph of \(x=|y|+1\) consists of all \(x\)-values greater than or equal to \(1\text{,}\) \([1,\infty)\text{,}\) and the range consists of all real numbers, \(\mathbb{R}=(-\infty,\infty)\text{.}\)
Example58
Determine the domain and range of the following relation. 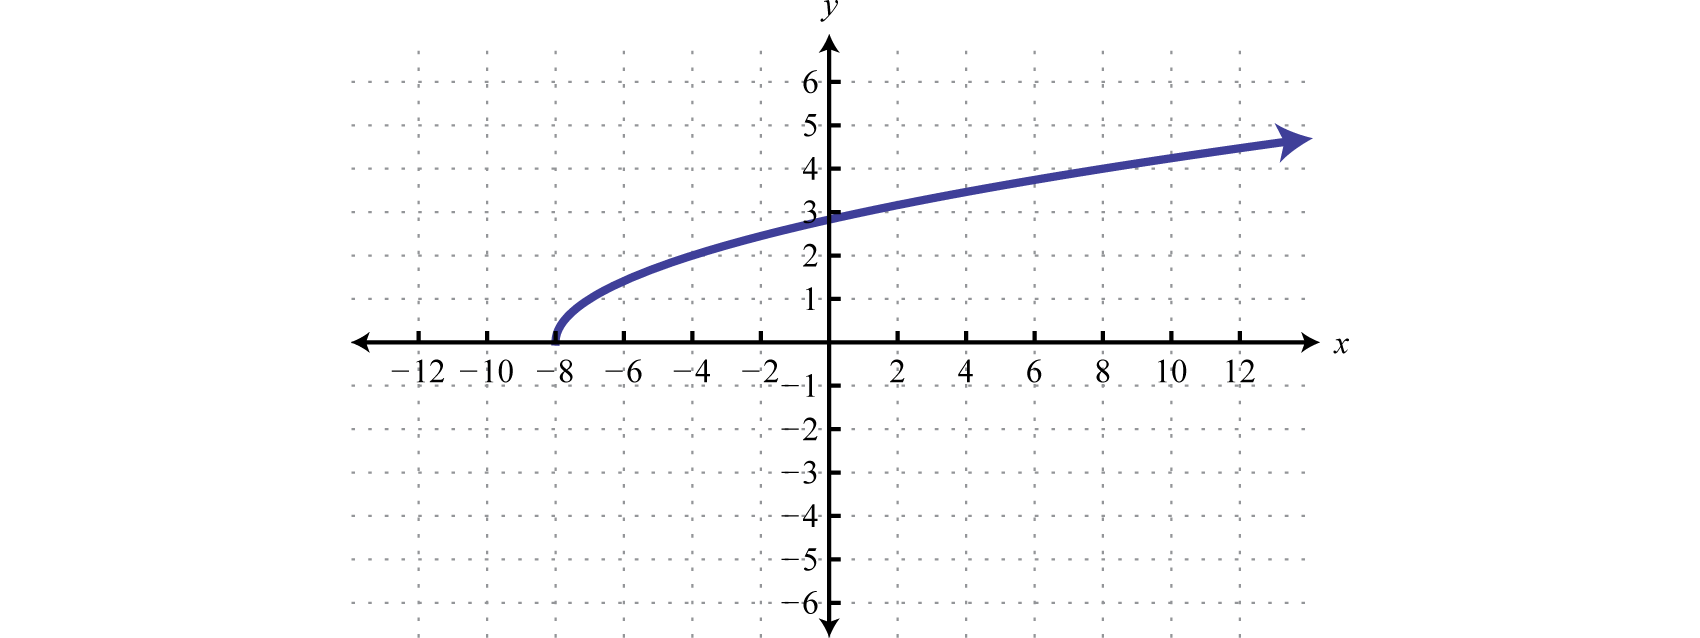
SolutionThe minimum \(x\)-value represented on the graph is \(-8\) and all others are larger. Therefore the domain consists of all \(x\)-values in the interval \([-8,\infty)\text{.}\) The minimum \(y\)-value represented on the graph is \(0\) so the range is \([0,\infty)\text{.}\)
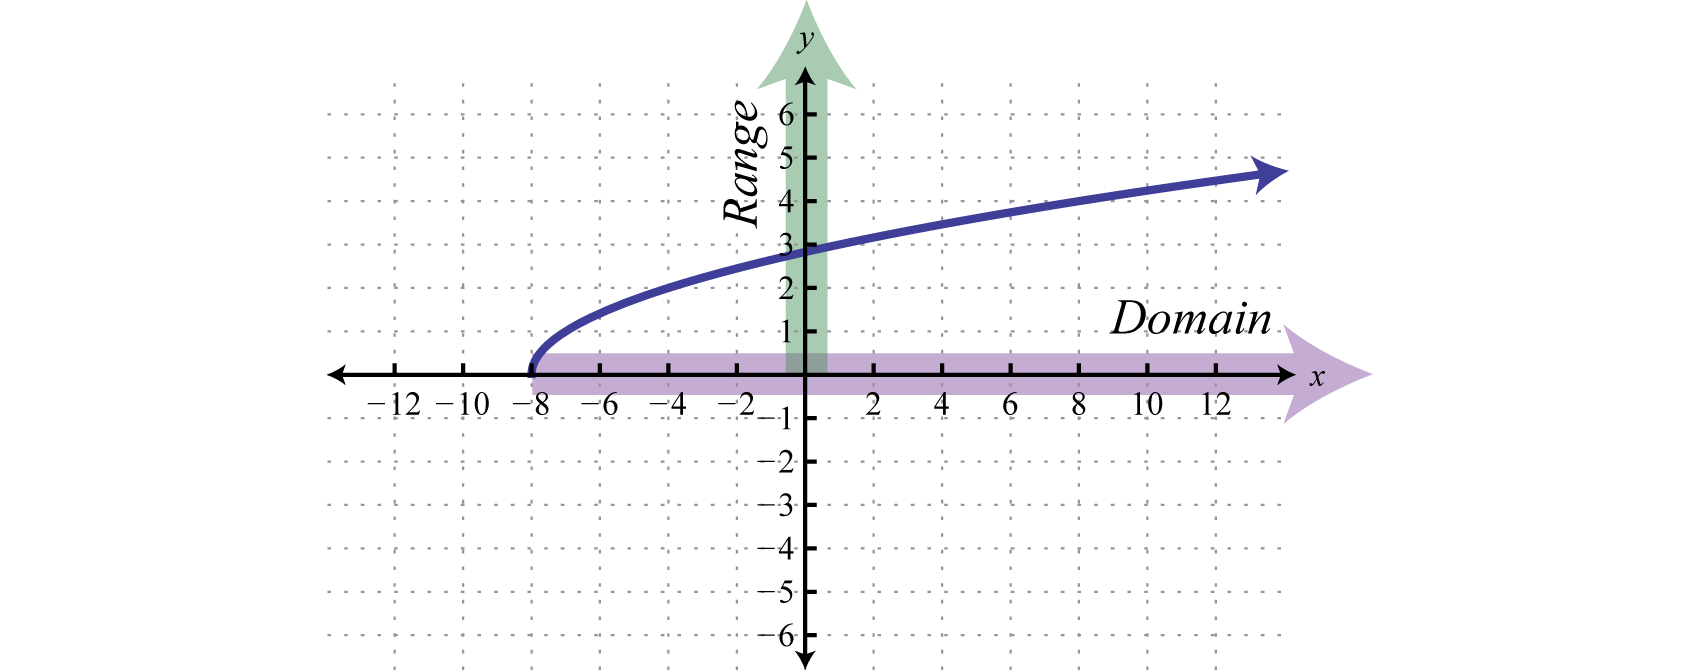
The domain is given by \([-8,\infty)\) and the range is \([0,\infty)\text{.}\)
SubsectionFunctions
Of special interest are relations where every \(x\)-value corresponds to exactly one \(y\)-value. A relation with this property is called a function.
Example59
Determine the domain and range of the following relation and state whether it is a function or not: \(\lbrace (-1,4),(0,7),(2,3),(3,3),(4,-2)\rbrace\text{.}\)
SolutionHere we separate the domain (\(x\)-values), and the range (\(y\)-values), and depict the correspondence between the values with arrows.

The relation is a function because each \(x\)-value corresponds to exactly one \(y\)-value. The domain is \(\{-1, 0, 2, 3, 4\}\) and the range is \(\{-2, 3, 4, 7\}\text{.}\)
Example60
Determine the domain and range of the following relation and state whether it is a function or not: \(\lbrace (-4,-3),(-2,6),(0,3),(3,5),(3,7)\rbrace\text{.}\)
Solution
The relation is not a function because the \(x\)-value \(3\) corresponds to two \(y\)-values. We can also recognize functions as relations where no \(x\)-values are repeated (ignoring redundancy). The domain is \(\{-4, -2, 0, 3\}\) and the range is \(\{-3, 3, 5, 6, 7\}\text{.}\)
Consider the relations consisting of the seven ordered pair solutions to \(y=|x|-2\) and \(x=|y|+1\text{.}\) The correspondence between the domain and range of each can be pictured as follows:
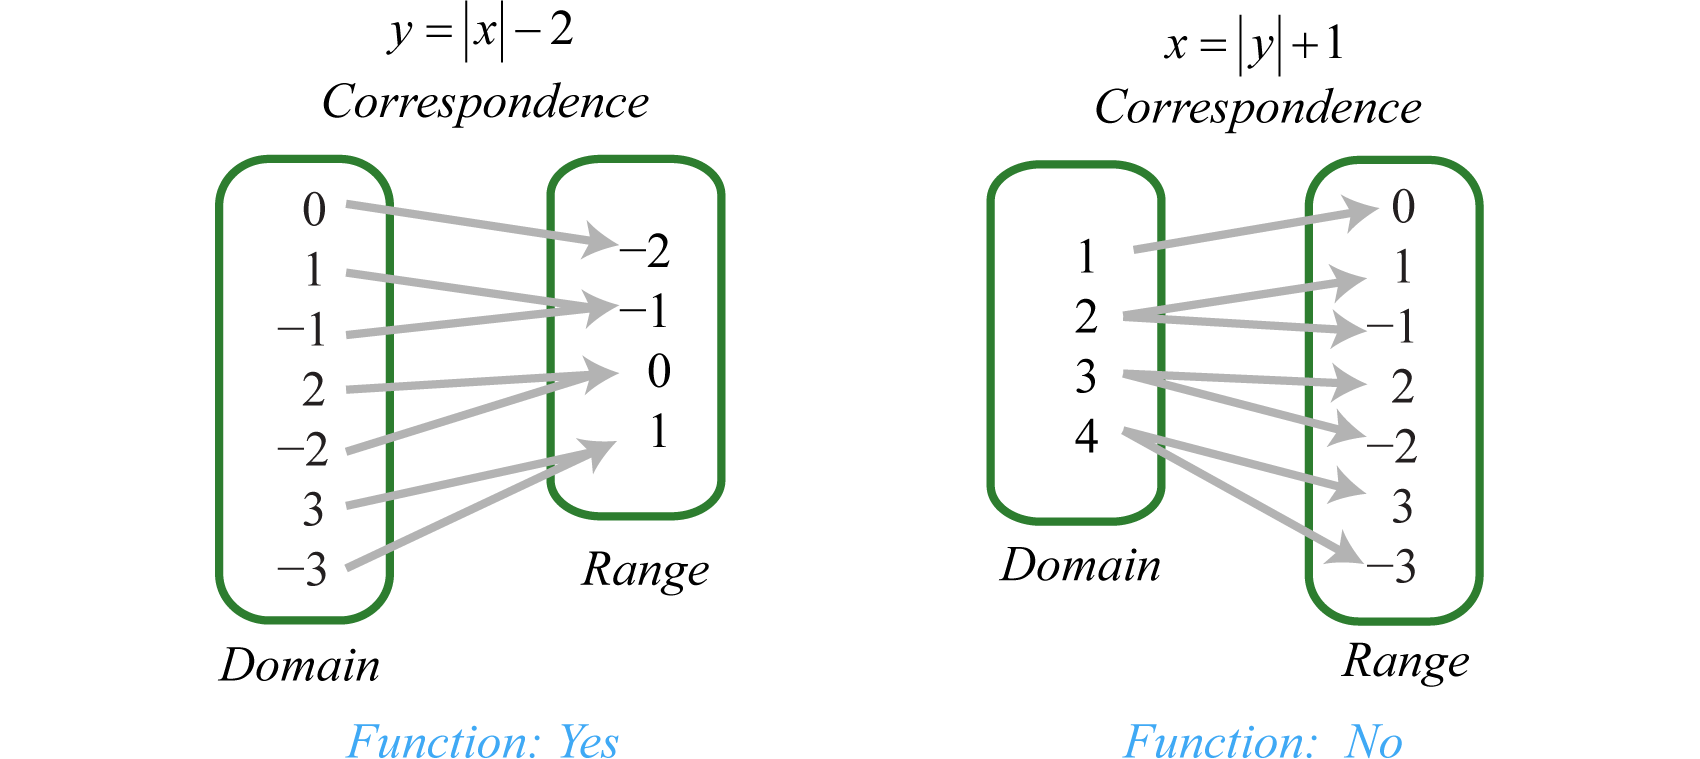
Notice that every element in the domain of the solution set of \(y=|x|-2\) corresponds to only one element in the range; it is a function. The solutions to \(x=|y|+1\text{,}\) on the other hand, have values in the domain that correspond to two elements in the range. In particular, the \(x\)-value \(4\) corresponds to two \(y\)-values \(-3\) and \(3\text{.}\) Therefore, \(x=|y|+1\) does not define a function.
We can visually identify functions by their graphs using the vertical line test. If any vertical line intersects the graph more than once, then the graph does not represent a function.
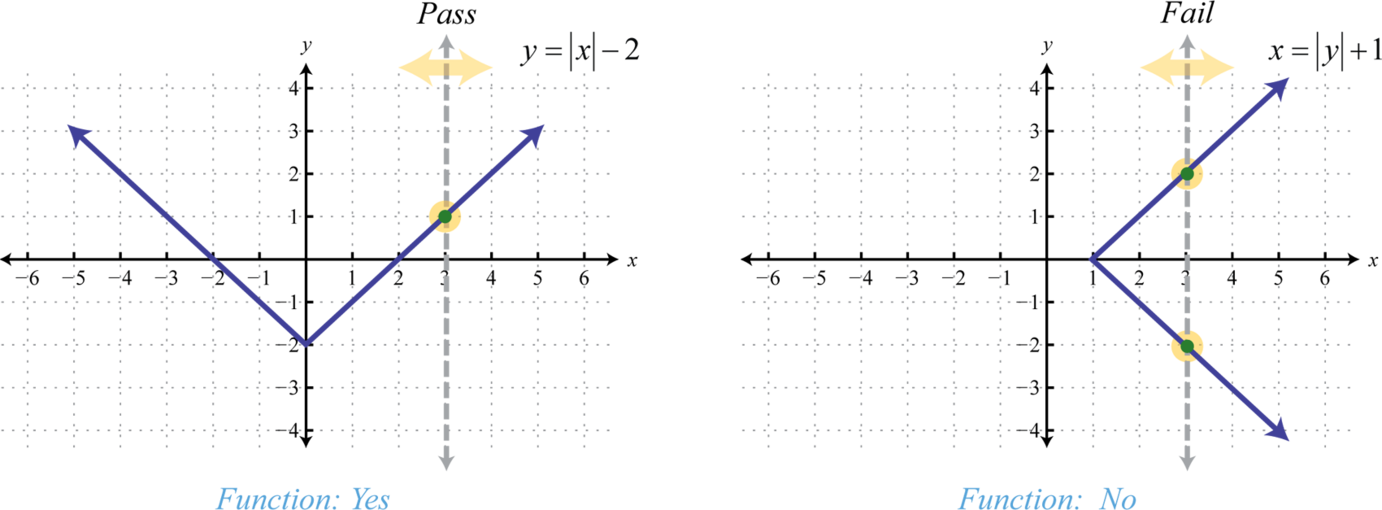
The vertical line represents a value in the domain, and the number of intersections with the graph represent the number of values to which it corresponds. As we can see, any vertical line will intersect the graph of \(y=|x|-2\) only once; therefore, it is a function. A vertical line can cross the graph of \(x=|y|+1\) more than once; therefore, it is not a function. As pictured, the \(x\)-value \(3\) corresponds to more than one \(y\)-value.
Example61
Given the graph, state the domain and range and determine whether or not it represents a function:
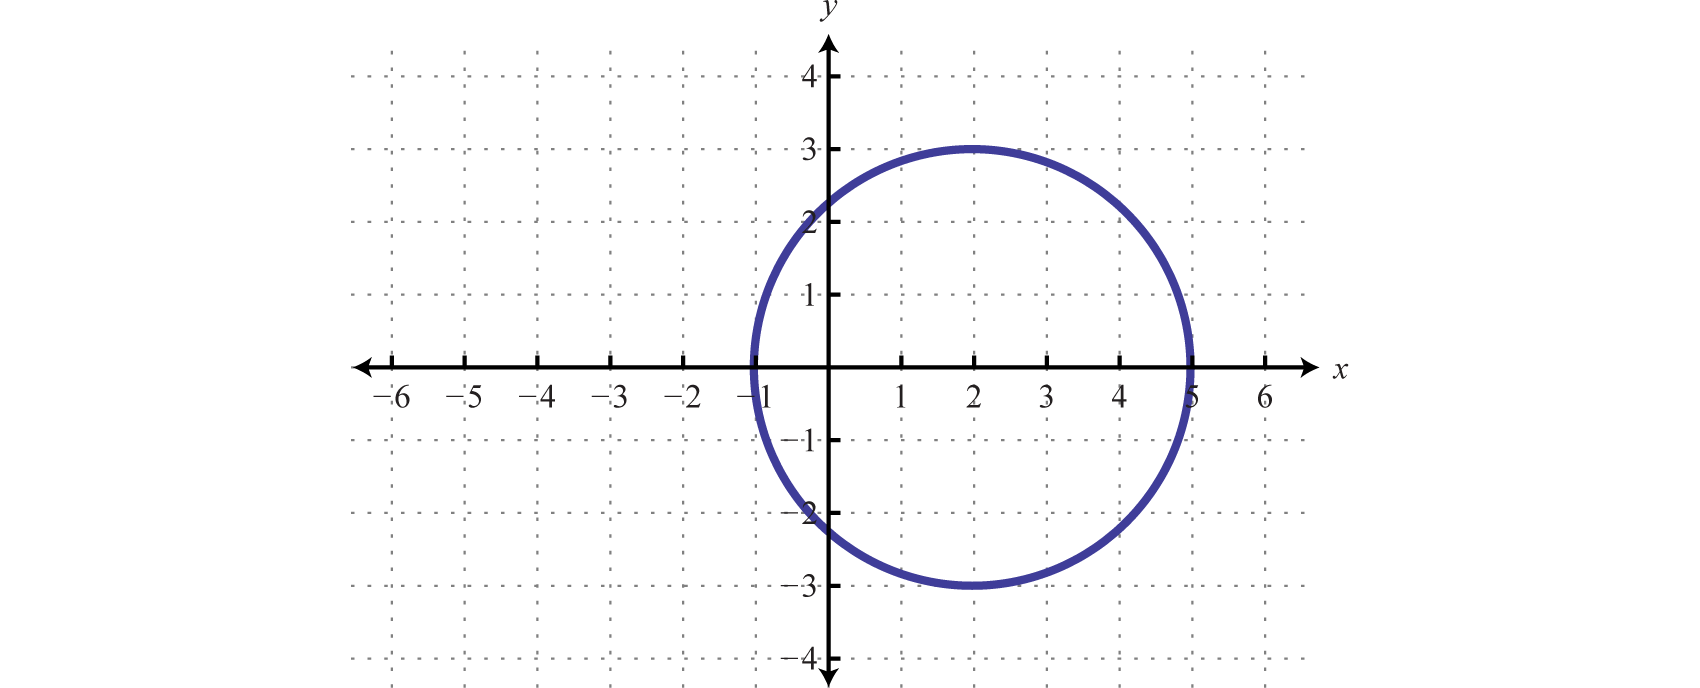
SolutionFrom the graph we can see that the minimum \(x\)-value is \(-1\) and the maximum \(x\)-value is \(5\text{.}\) Hence, the domain consists of all the real numbers in the set from \([-1,5]\text{.}\) The maximum \(y\)-value is \(3\) and the minimum is \(-3\text{,}\) so the range consists of \(y\)-values in the interval \([-3,3]\text{.}\)
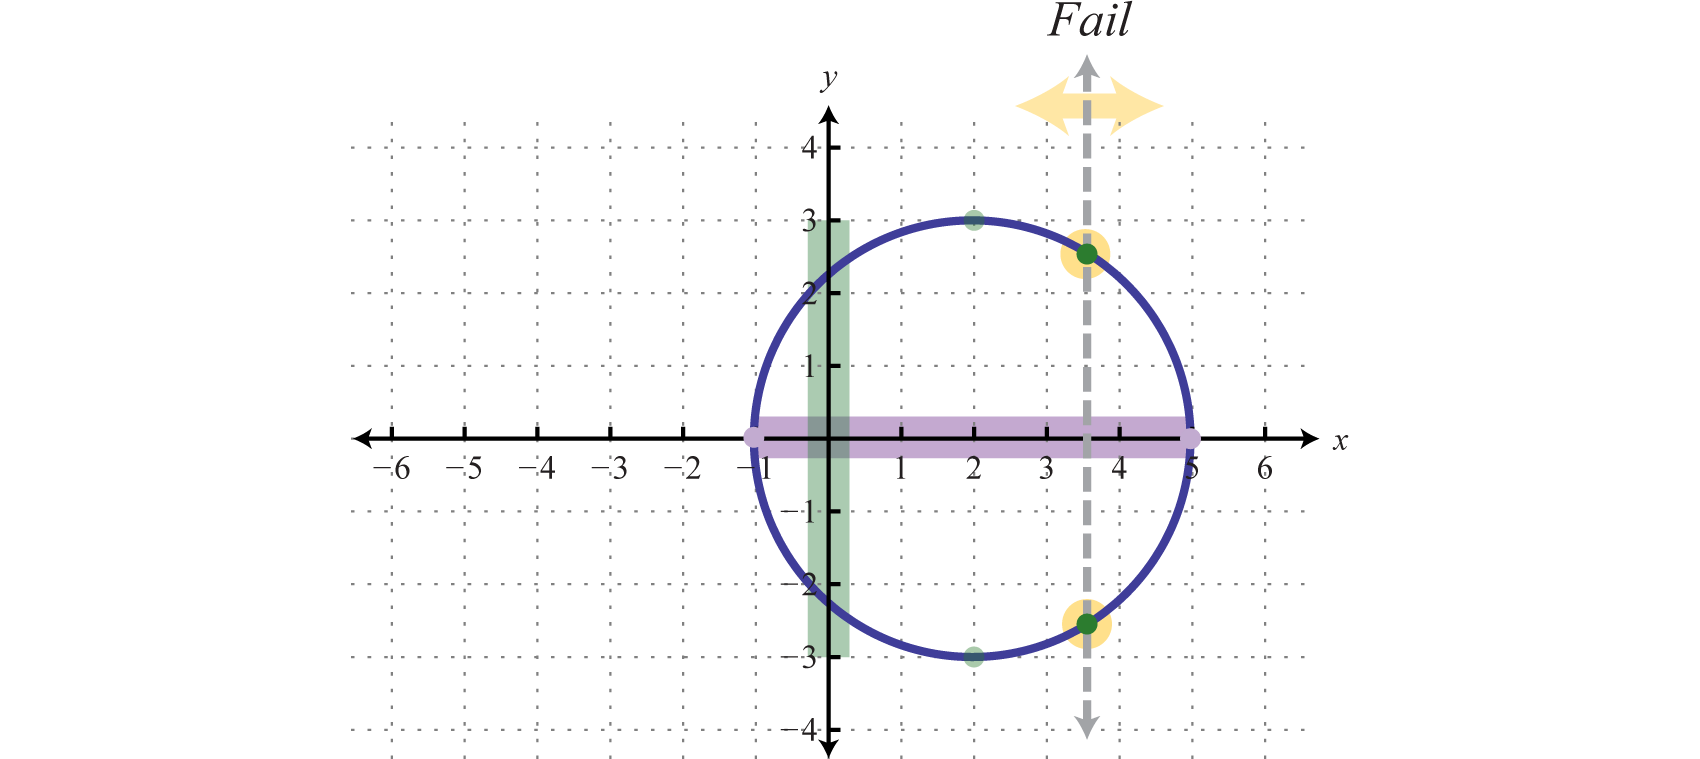
In addition, since we can find a vertical line that intersects the graph more than once, we conclude that the graph is not a function. There are many \(x\)-values in the domain that correspond to two \(y\)-values.
The domain, in interval notation, is \([-1,5]\) and the range is \([-3,3]\text{.}\) The relation is not a function.
Exercise62
Given the graph, state the domain and range and determine whether or not it represents a function:
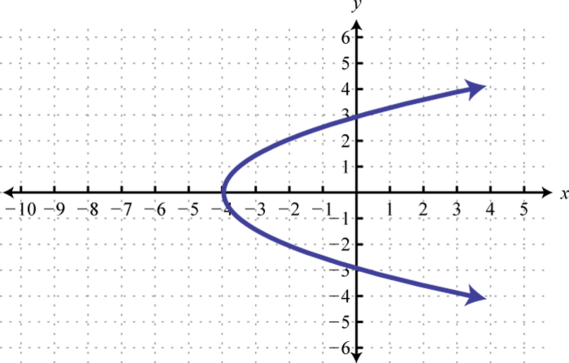
SolutionThe domain, in interval notation, is \([-4,\infty)\) and the range is \(\mathbb{R}=(-\infty,\infty)\text{.}\) The relation is not a function.
SubsectionFunction Notation
With the definition of a function comes special notation. If we consider each x-value to be the input that produces exactly one output, then we can use function notation:
\begin{gather*}
f(x)=y
\end{gather*}
The notation \(f(x)\) is read as, \(f\) of \(x\) and should not be confused with multiplication. Algebra frequently involves functions, and so the notation becomes useful when performing common tasks. Here \(f\) is the function name, and \(f(x)\) denotes the value in the range associated with the value \(x\) in the domain. Functions are often named with different letters; some common names for functions are \(f, g, h, C\text{,}\) and \(R\text{.}\) We have determined that the set of solutions to \(y=|x|-2\) is a function; therefore, using function notation we can write \(\alert{f(x)}=|x|-2\) instead of \(y=|x|-2\text{.}\)
It is important to note that \(y\) and \(f(x)\) are used interchangeably. This notation is used as follows:
\begin{align*}
f(x)\amp = |x|-2\\
f(-5)\amp=|-5|-2=5-2=3
\end{align*}
Here the compact notation \(f(-5)=3\) indicates that where \(x=-5\) (the input), the function results in \(y=3\) (the output). In other words, replace the variable with the value given inside the parentheses.

From above, we can see that our output depends on our input. Another way we define this is to call our input \(x\) the independent variable and our output \(y\) the dependent variable. Indeed, above, our function's output was dependent upon what the input was - when we put in \(-5\text{,}\) we got out the answer \(3\text{.}\)
Example63
Consider the function \(M=53+14t\) where \(M\) represents miles from home on Gabby's bike trip as a function of \(t\text{,}\) the number of hours since Gabby left her office. Which is the independent variable, and which is the dependent variable?
SolutionWhen translating word problems to equations it may help to remember that the phrase "a function of", tells us our input, or independent variable is time \(t\text{.}\)
The independent variable is \(t\text{,}\) and the dependent variable is \(M\text{.}\)
Function notation streamlines the task of evaluating. For example, use the function \(h\) defined by \(h(x)=\frac{1}{2}x-3\) to evaluate for \(x\)-values in the set \({-2,0,7}\text{.}\)
\begin{gather*}
h(-2)=\frac{1}{2}(-2)-3=-1-3=-4\\
h(0)=\frac{1}{2}(0)-3=0-3=-3\\
h(7)=\frac{1}{2}(7)-3=\frac{7}{2}-3=\frac{1}{2}
\end{gather*}
Given any function defined by \(h(x)=y\) the input \(x\) can be any algebraic expression. For example:
\begin{gather*}
h(4a^3)=\frac{1}{2}(4a^3)-3=2a^3-3\\
h(2x-1)=\frac{1}{2}(2x-1)-3=x-\frac{1}{2}-3=x-\frac{7}{2}
\end{gather*}
Example64
Given \(g(x)=x^2\text{,}\) find \(g(-2), g\left(\frac{1}{2}\right)\text{,}\) and \(g(x+h)\text{.}\)
SolutionWhen evaluating, it is a best practice to begin by replacing the variables with parentheses and then substitute the appropriate values. This helps with the order of operations when simplifying expressions.
\begin{equation*}
\begin{aligned}
g(\alert{-2})\amp =(\alert{-2})^2=4\\
g\left(\alert{\frac{1}{2}}\right)\amp =\left(\alert{\frac{1}{2}}\right)^2=\frac{1}{4}\\
g(\alert{x+h})\amp =(\alert{x+h})^2=(x+h)(x+h)=x^2+2xh+h^2
\end{aligned}
\end{equation*}
At this point, it is important to note that, in general, \(f(x+h)\neq f(x)+f(h)\text{.}\) The previous example, where \(g(x)=x^2\text{,}\) illustrates this nicely.
\begin{equation*}
\begin{aligned}
g(x+h)\amp\neq g(x)+g(h)\\
(x+h)^2\amp\neq x^2+h^2
\end{aligned}
\end{equation*}
Example65
Given \(k(x)=\sqrt{2x+4}\text{,}\) find \(k(-2)\text{,}\) and \(k(0)\text{.}\)
Solution
\begin{equation*}
\begin{aligned}
k(-2)\amp =\sqrt{2(\alert{-2})+4}=\sqrt{-4+4}=\sqrt{0}=0\\
k(0)\amp = \sqrt{2(\alert{0})+4}=\sqrt{0+4}=\sqrt{4}=2\\
\end{aligned}
\end{equation*}
Example66
Given the graph of \(g(x)\text{,}\) find \(g(-8),\, g(0),\) and \(g(8)\text{.}\)
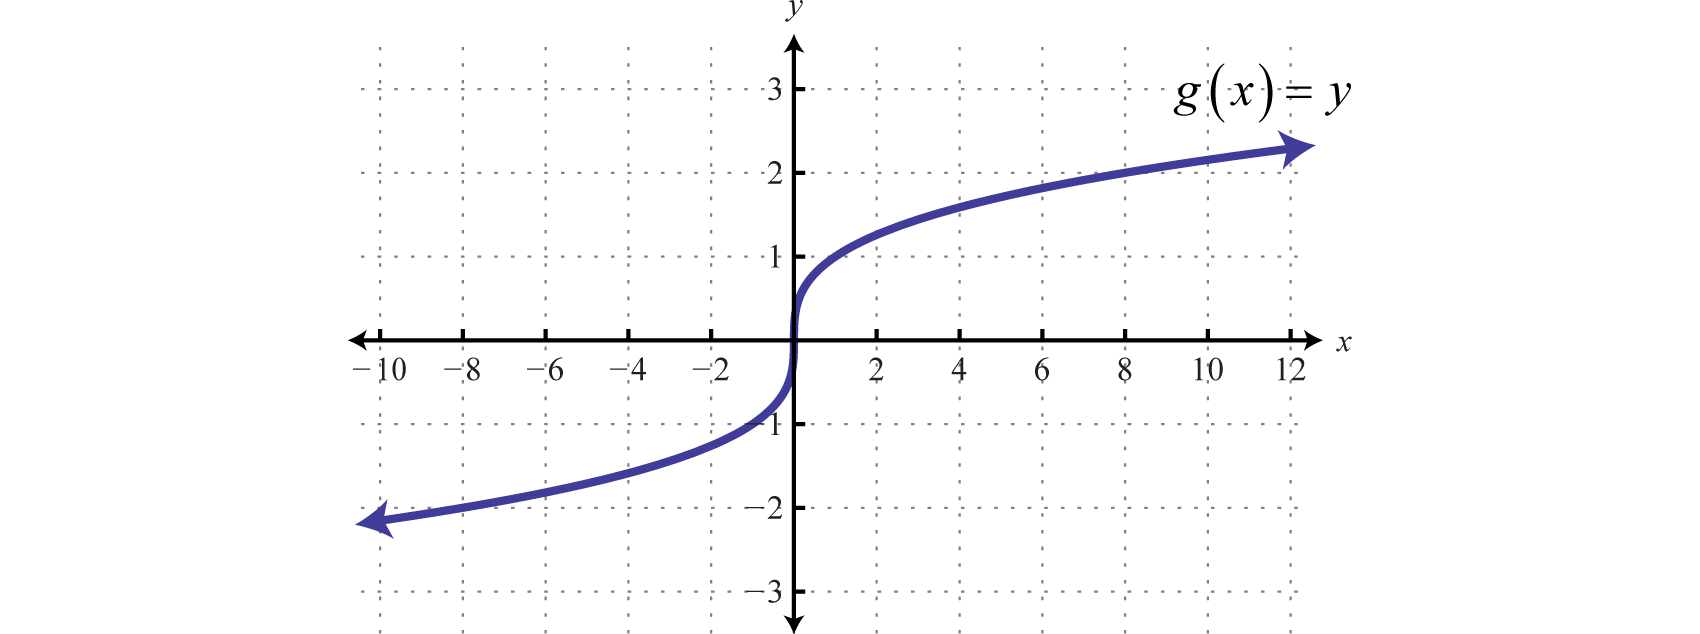
SolutionUse the graph to find the corresponding \(y\)-values where \(x = -8, 0,\) and \(8\text{.}\)
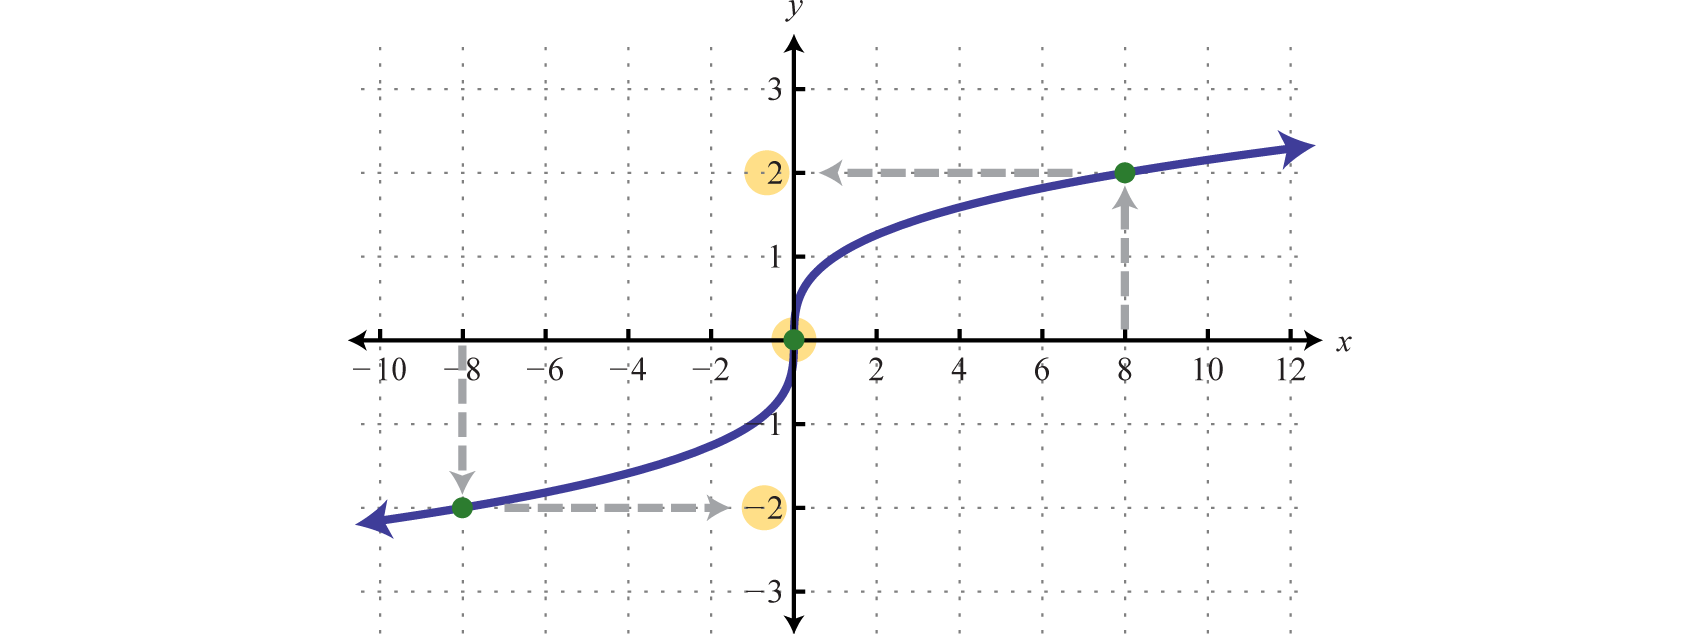
We find that \(g(-8)=-2,\, g(0)=0\text{,}\) and \(g(8)=2\text{.}\)
Sometimes the output is given and we are asked to find the input.
Example67
Given \(f(x)=5x+7\text{,}\) find \(x\) where \(f(x)=27\text{.}\)
SolutionIn this example, the output is given and we are asked to find the input. Substitute \(f(x)\) with \(27\) and solve the resulting equation.
\begin{equation*}
\begin{aligned}
f(x)\amp =5x+7\\
27\amp =5x+7\\
20\amp = 5x\\
4\amp =x
\end{aligned}
\end{equation*}
Therefore \(f(4)=27\text{.}\) As a check, we can evaluate \(f(4)=5(4)+7=27\text{.}\)
Example68
Given the graph of \(g(x)\text{,}\) find \(x\) where \(g(x)=2\text{.}\)
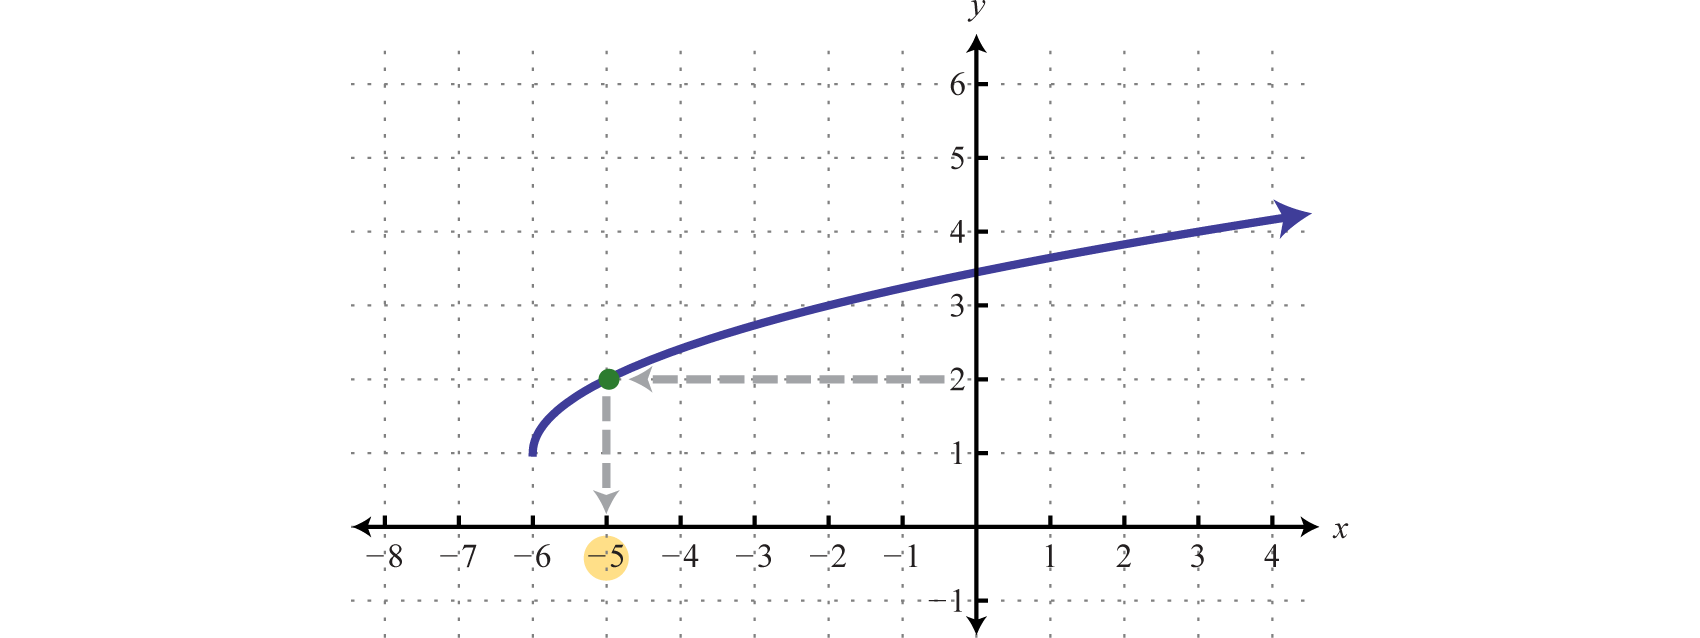
SolutionHere we are asked to find the \(x\)-value corresponding to a particular \(y\)-value. We begin with \(2\) on the \(y\)-axis and then read the corresponding \(x\)-value.
We can see that \(g(x)=2\) where \(x=-5\text{,}\) which means \(g(-5)=2\text{.}\)
Example69
Given the graph of \(h(x)\text{,}\) find \(x\) where \(h(x)=-4\text{.}\)
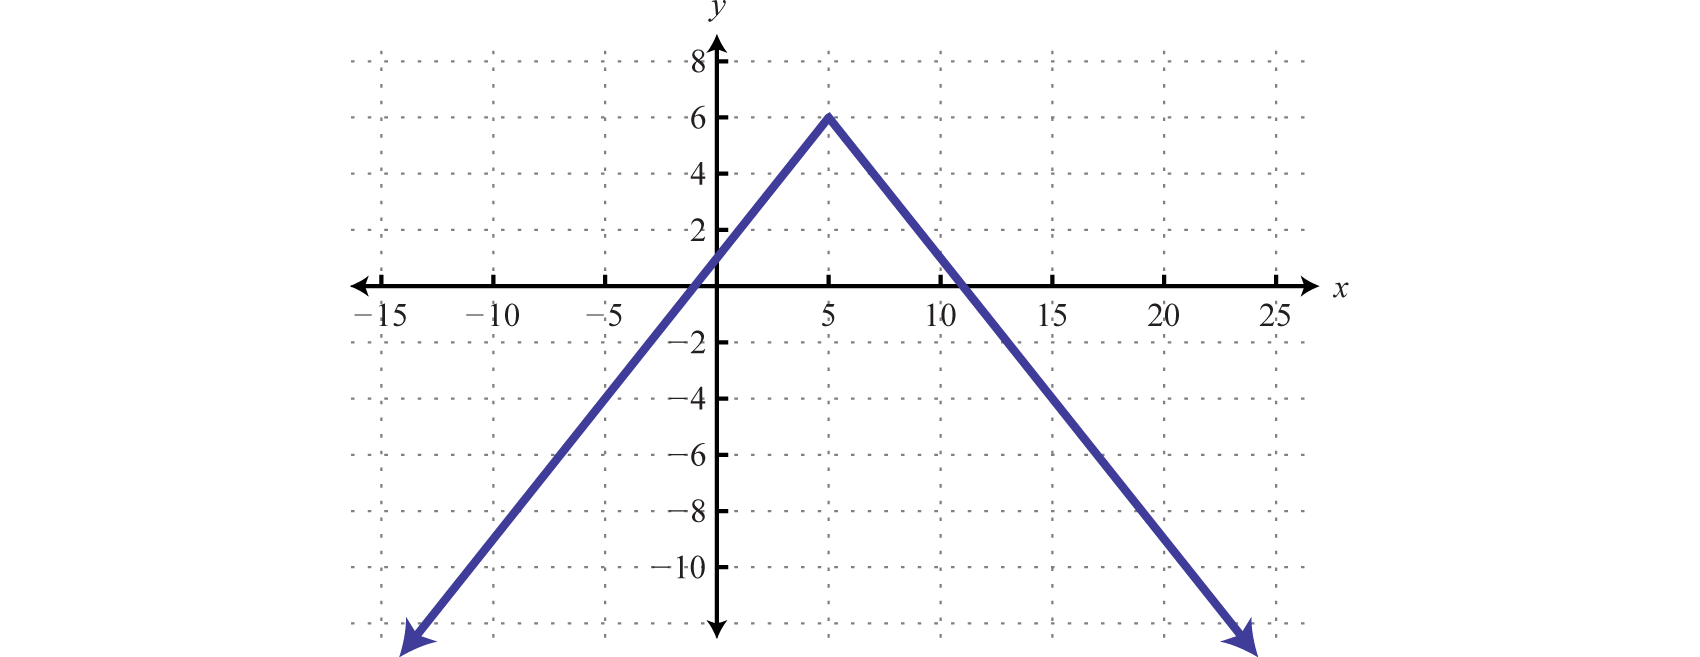
SolutionWe can see that \(h(x)=-4\) where \(x=-5\) AND where \(x=15\text{.}\)
