Subsubsection 8.2.2.1 Compactness
One characteristic which can be described mathematically that is sometimes regarded as an indicator for whether a voting district has been gerrymandered is the notion of compactness. A shape is considered compact when it encloses as much area as possible for a given perimeter.
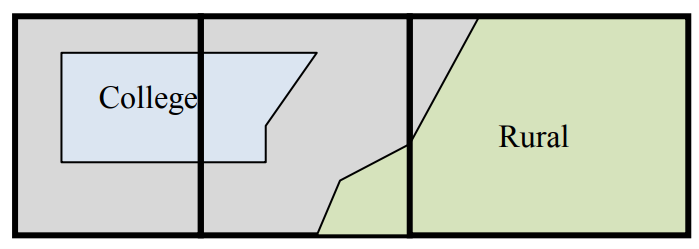
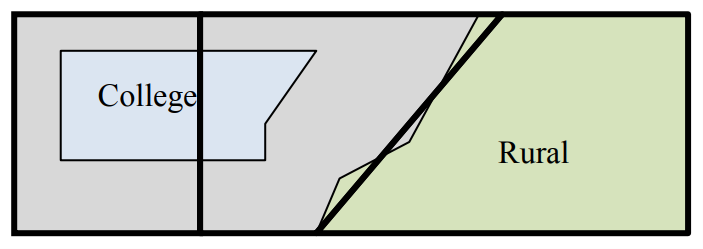
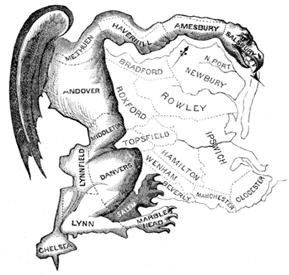
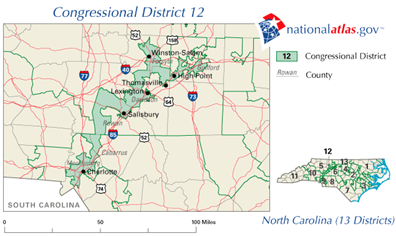
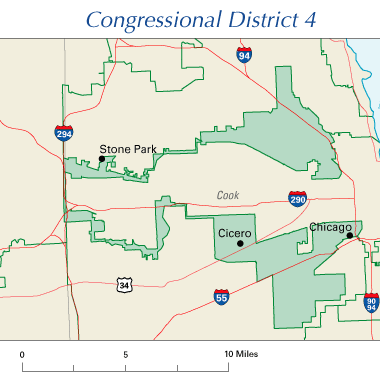
We can recognize shapes that are compact intuitively. For example, we can quickly surmise that the "salamander" shape in the image above is not very compact, while the entire shape (the salamander plus the regions in the image with lighter outlines) is more compact.
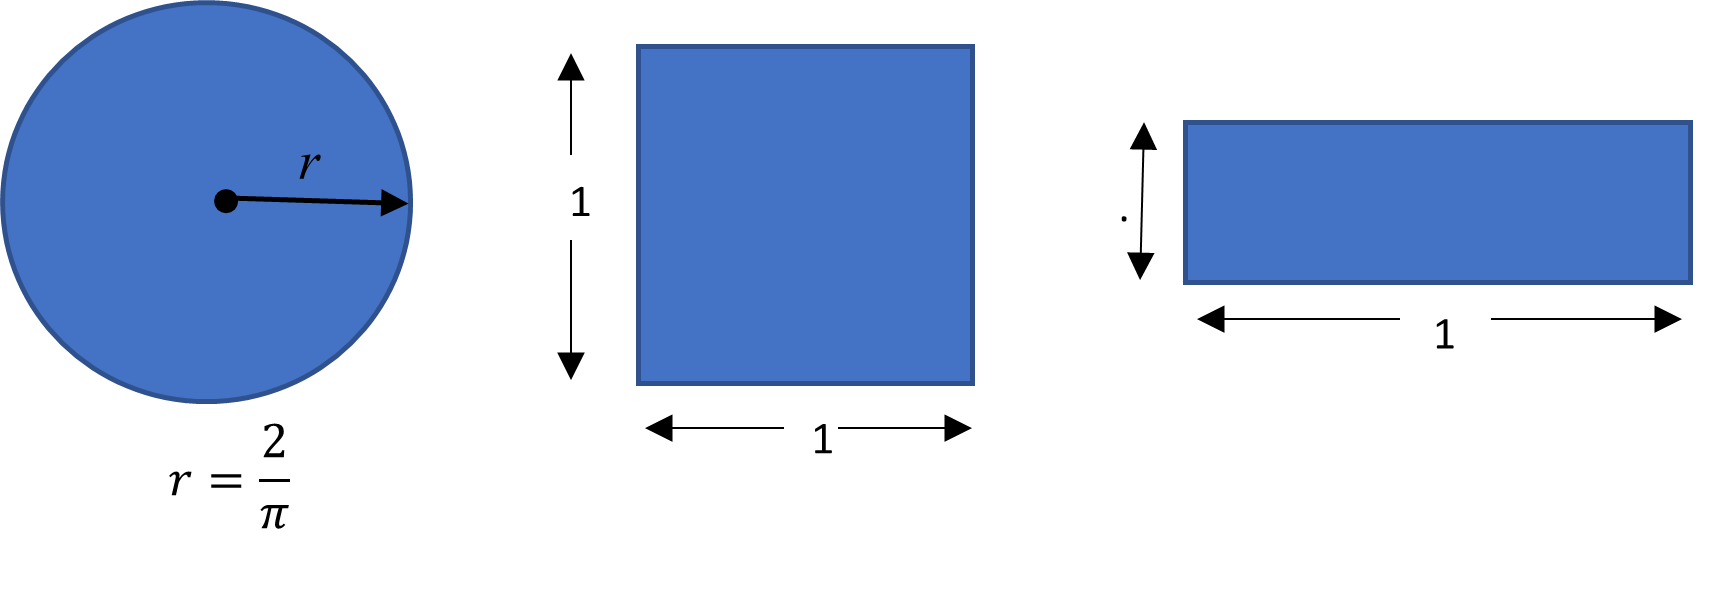
What about other, more familiar two-dimensional geometric shapes? The circle, the square and the rectangle below, are drawn so they all have the same perimeter of approximately 4 units. (Recall that for a circle, the perimeter is called the circumference.)
Can you tell just by looking at them which shape has the greatest area? Let’s check.
|
Circle |
Square |
Rectangle |
| Perimeter |
\(C = 2 \pi r = 4\) |
\(P = 1+1+1+1 = 4\) |
\(P = 0.5+1.5+0.5+1.5 = 4\) |
| Area (units\(^2\)) |
\(A = \pi r^2 = \frac{4}{\pi} \approx 1.27\) |
\(A = l \times w = 1 \times 1 = 1\) |
\(A = l \times w = 0.5 \times 1.5 = 0.75\) |
If you guessed the circle, you’re correct; the familiar geometric shape that is the most compact is the circle because it has the greatest area for a given perimeter.
As you can see, it is helpful to use numerical values to compare the compactness of a shape. Unfortunately, most of the shapes of voting districts are not going to be this simple. Nevertheless, having a way to quantify the compactness of a voting district is helpful. One way to do this is to use what is known as the Polsby-Popper Score.
Polsby-Popper Score.
The Polsby-Popper Score (PPS) is a measure of the compactness of a voting district given by the formula
\begin{equation*}
\text{PPS} = \frac{4 \pi (\text{Area of District})}{(\text{Perimeter of District})^2}
\end{equation*}
The PPS always falls in the interval [0, 1]. Scores near 0 indicate a lack of compactness, while a score of 1 is the maximum level of compactness.
You might notice the formula involves circles since it includes the number \(\pi\text{.}\) Since circles enclose the most area for a given perimeter, this formula compares the ratio of the area to the perimeter (squared) of any shape to that of a circle, which always has a PPS value of 1.
Example 8.2.4.
Assume the circle, square, and rectangle are voting districts and calculate their PPS scores.
Circle:
\begin{equation*}
\text{PPS} = \frac{4 \pi (\text{Area of District})}{(\text{Perimeter of District})^2} = \frac{4 \pi \cdot 1.27}{4^2} = 1
\end{equation*}
Square:
\begin{equation*}
\text{PPS} = \frac{4 \pi \cdot 1}{4^2} \approx 0.79
\end{equation*}
Rectangle:
\begin{equation*}
\text{PPS} = \frac{4 \pi \cdot 0.75}{4^2} \approx 0.59
\end{equation*}
Example 8.2.5.
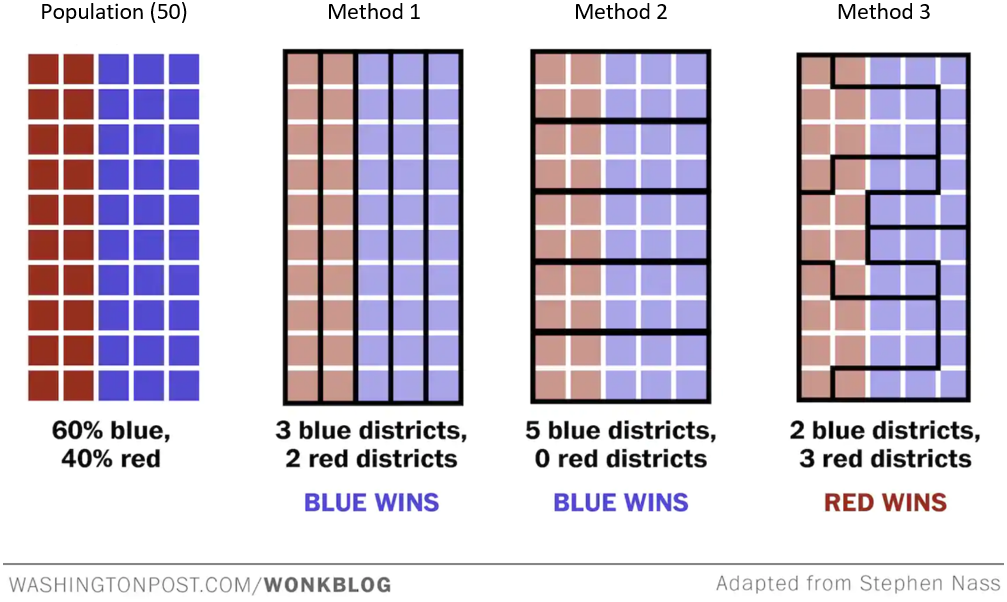
Method 1: All of the districts are the same size. Their perimeter is 22 units and their area is 10 square units. Thus the PPS of each district is given by
\begin{equation*}
\text{PPS} = \frac{4 \pi \cdot 10}{22^2} \approx 0.26
\end{equation*}
Method 2: All of the districts are the same size. Their perimeter is 14 units and their area is 10 square units. Thus the PPS of each district is given by
\begin{equation*}
\text{PPS} = \frac{4 \pi \cdot 10}{14^2} \approx 0.64
\end{equation*}
-
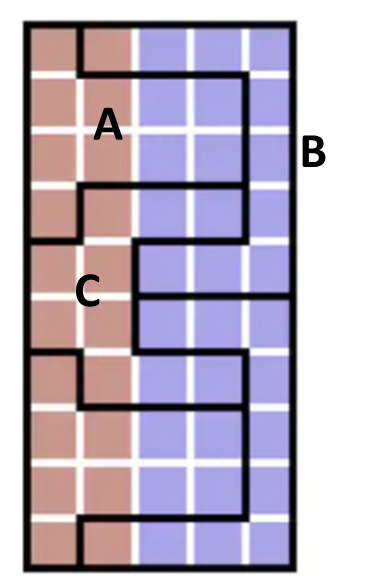
Method 3:
Shape A:
\begin{equation*}
\text{PPS} = \frac{4 \pi \cdot 10}{16^2} \approx 0.49
\end{equation*}
Shape B:
\begin{equation*}
\text{PPS} = \frac{4 \pi \cdot 10}{22^2} \approx 0.26
\end{equation*}
Shape C:
\begin{equation*}
\text{PPS} = \frac{4 \pi \cdot 10}{20^2} \approx 0.31
\end{equation*}
Let’s look again at the districting methods shown in
Figure 8.2.3:
Although the PPS of each district is calculated in the previous example, you can tell just by looking at them that the districts in Method 2 are more compact than those in Method 1. Yet the election results of Method 1 are more fair (since they are more aligned with the voting population) than those in Method 2. We see here that although compactness can sometimes be an indicator for whether a district has been gerrymandered, it is not a guarantee. Consequently, we consider another method.
Subsubsection 8.2.2.2 Efficiency Gaps
(Developed by Nicholas Stephanopoulos and Eric McGhee, this method was used in a federal court (Whitford v. Gill, 2016) to declare a legislative map invalid because it evidenced gerrymandering.)
Since shape and compactness are not sufficient for detecting gerrymandering, other methods for quantifying the strategic manipulation of voting districts are needed. Another, more reliable way to measure the degree to which a districting plan is gerrymandered is to compare what we call the efficiency gaps of the parties involved in an election. To learn this method, we first need to think about what it means for a vote to be wasted.
Wasted Votes.
We say votes from a given district can be wasted in two ways:
If a party wins the district, any votes for that party past the number necessary to win are wasted.
If a party loses the district, all votes for that party are wasted.
To learn how to identify wasted votes, let’s work an example.
Example 8.2.6.
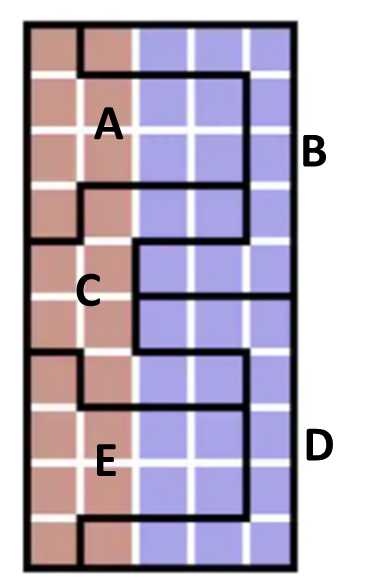
Find the votes wasted by each party in Method 3 of
Figure 8.2.3.
First, we note that there are 10 voters in each district, so 6 are needed to win a district-level election.
District A: There are exactly 6 red votes. Since all of these are needed to win the election, none of them are wasted. Since Blue lost the election in this district, all 4 blue votes are wasted.
District B: There are 9 blue votes and 1 red vote. Since only six of them are needed to win, 3 blue votes are wasted. Since Blue won the election, 1 red vote is wasted.
The full list of wasted votes for all of the districting methods in
Figure 8.2.3, along with the totals for each district, appear in the table below.
| Wasted votes |
District A |
District B |
District C |
District D |
District E |
Total Wasted |
| Red party |
0 |
1 |
0 |
1 |
0 |
2 |
| Blue party |
4 |
3 |
4 |
3 |
4 |
18 |
We are now ready to define a new measure for detecting gerrymandering.
Efficiency Gap.
The efficiency gap (EG) of a districting plan is a ratio given by the formula
\begin{equation*}
\text{EG} = \frac{|W_A - W_B|}{T}
\end{equation*}
where \(T\) is the total number of votes cast and \(W_A\) and \(W_B\) are the total number of wasted votes for parties A and B, respectively.
If \(0 \leq \text{EG} < 0.07\) (or 7%) the plan is considered fair.
If \(0.07 \leq \text{EG} < 1\) the plan is considered unfair in favor of the party with the least number of wasted votes.
To calculate the Efficiency Gap for Method 3 in
Figure 8.2.3, we let A be the red party and B be the blue party and note that the total number of votes cast in the election is
\(T = 50\text{.}\) Then we compute the following:
\begin{equation*}
\text{EG} = \frac{|W_A - W_B|}{T} = \frac{|2 - 18|}{50} = \frac{|-16|}{50} = \frac{16}{50} = 0.32
\end{equation*}
Since 0.32 is larger than 0.07, we can conclude that this election is unfair in favor of red (since red had the least number of wasted votes).
Example 8.2.7.
Calculate the efficiency gap EG for districting Method 1 and Method 2 in
Figure 8.2.3. Let A be the red voters and B be the blue voters.
Method 1: Since there are 10 voters in each district, 6 votes are needed to win. In the first two districts, all votes are red, so 4 votes are wasted in each district. In the remaining three districts blue wins, wasting 4 votes per district. Thus, we have
\begin{equation*}
\text{EG} = \frac{|W_A - W_B|}{T} = \frac{|8 - 12|}{50} = \frac{|-4|}{50} = \frac{4}{50} = 0.08
\end{equation*}
Since 0.08 is larger than 0.07, this districting method favors red (but only slightly) since red had the least number of wasted votes.
Method 2: Each of the districts have the same number of red and blue votes. Since all six blue votes are needed to win the district election, there are zero wasted blue votes. Since blue won each district, all four red votes in each district are wasted, for a total of 20 wasted votes. Thus, we have
\begin{equation*}
\text{EG} = \frac{|W_A - W_B|}{T} = \frac{|20 - 0|}{50} = \frac{20}{50} = 0.4
\end{equation*}
Since 0.4 is larger than 0.07, this districting method significantly favors blue since blue had the least number of wasted votes.
Though the efficiency gap is a better measure of fairness than compactness, it still has weaknesses when being used to detect gerrymandering. Researchers continue to look for ways to monitor the fairness of districting methods in elections.