In many decision making situations, it is necessary to gather the group consensus. This happens when a group of friends decides which movie to watch, when a company decides which product design to manufacture, and when a democratic country elects its leaders.
While the basic idea of voting is fairly universal, the method by which those votes are used to determine a winner can vary. Amongst a group of friends, you may decide upon a movie by voting for all the movies you’re willing to watch, with the winner being the one with the greatest approval. A company might eliminate unpopular designs then revote on the remaining. A country might look for the candidate with the most votes.
In deciding upon a winner, there is always one main goal: to reflect the preferences of the people in the most fair way possible.
Subsection7.1.1Preference Schedules
We use the word ballot to refer to whatever information a voter provides about their preferences. In many elections, a voter’s ballot consists of nothing more than their choice of one favorite candidate from the list of all possibilities. This system, however, fails to provide detailed information about voters’ preferences. In particular, we will be interested in voters’ rankings of all candidates: not only who a voter would choose first, but also their second, third, and subsequent choices.
Expressing voter preferences.
The options voters are choosing between are called alternatives. In an election for public office, these will be the candidates.
The complete rankings of the alternatives by each voter are called the preference lists. This information can be presented as a table, called a preference table or a preference schedule.
The information voters actually provide in an election is called a ballot. This may or may not include all the information included in the voter’s preference list.
A voting method is a set of rules that takes a set of alternatives and ballots and produces an outcome (i.e. a winner).
Example7.1.1.
A vacation club is trying to decide which destination to visit this year: Hawaii (H), Paris (P), or Colorado (C). Their votes are shown below:
Table7.1.2.
Bob
Ann
Mary
Alice
Eve
Omar
Lupe
Dave
Tish
Jim
1st choice
C
C
P
H
C
P
H
P
H
C
2nd choice
P
H
H
C
H
H
C
H
C
H
3rd choice
H
P
C
P
P
C
P
C
P
P
These individual ballots are typically combined into one preference schedule as follows:
Table7.1.3.
Number of votes
1
3
3
3
1st choice
C
C
P
H
2nd choice
P
H
H
C
3rd choice
H
P
C
P
This table tells us, for example, that one voter prefers Colorado first, then Paris, and lastly Hawaii. Three voters prefer Colorado first, followed by Hawaii and then Paris.
Also notice that by totaling the vote counts across the top of the preference schedule we can recover the total number of votes cast: 1+3+3+3=10 total votes.
It is important to emphasize that the outcome of an election depends on both the voters’ preferences and the voting method used. You should be very suspicious of any news story which claims, “Party X won the most seats the parliament of Country Y, indicated that voters strongly support the policies of Party X.” This is the case even if the country in question is a democracy with free and fair elections.
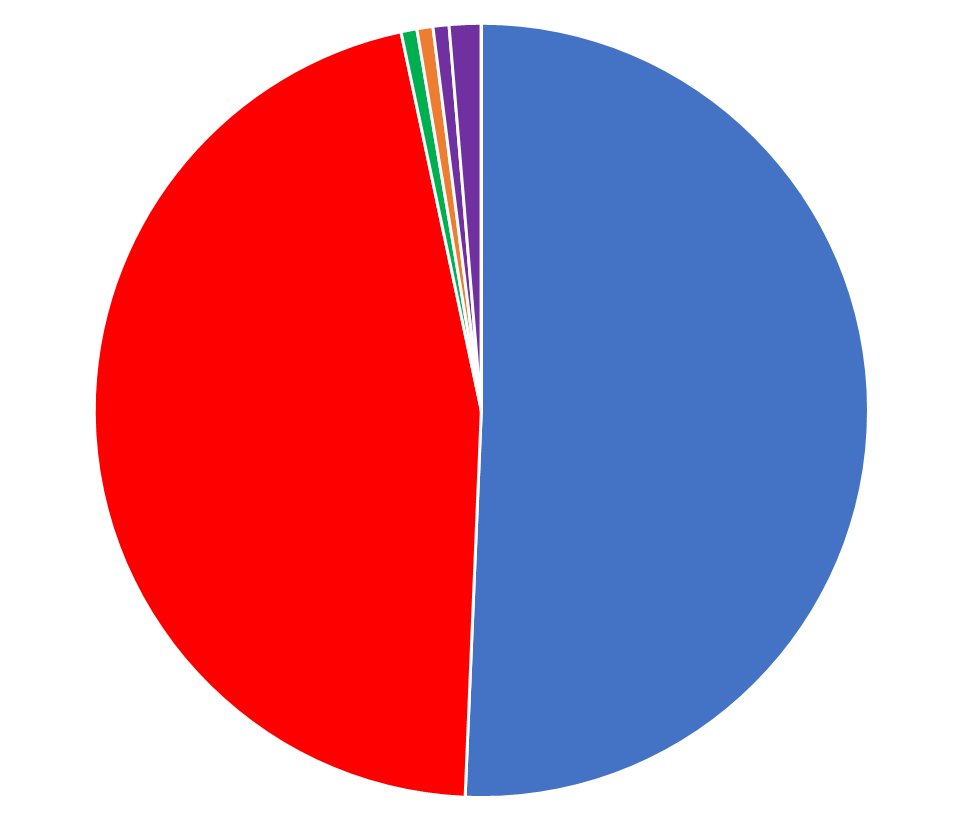
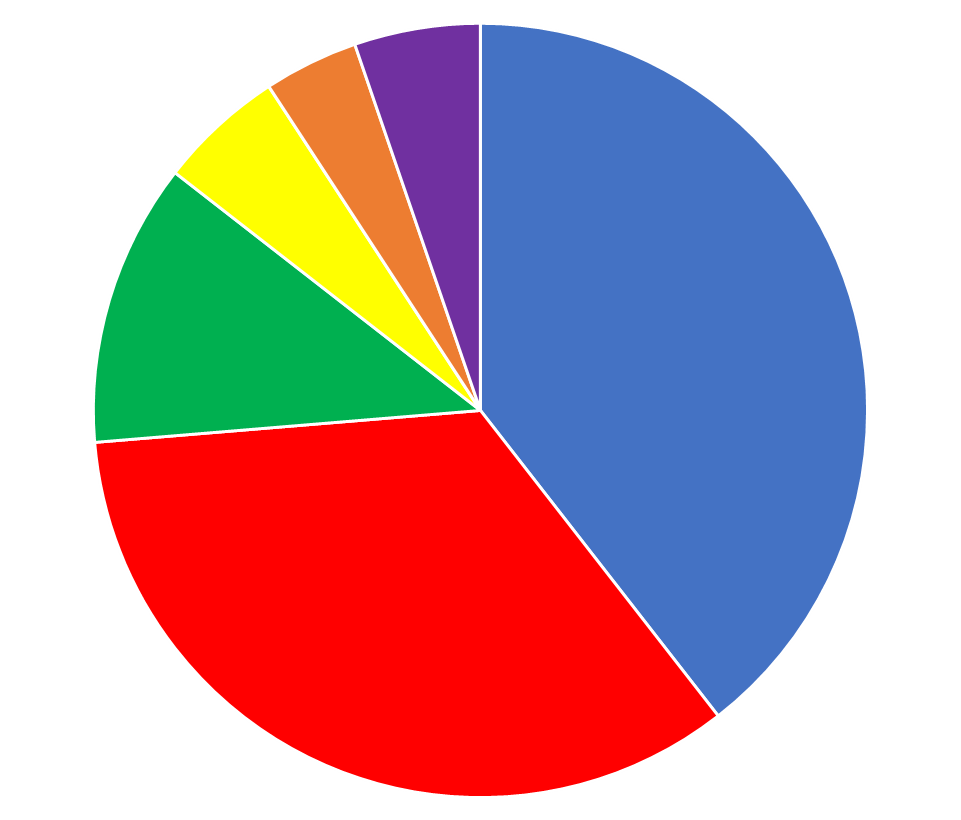
For a simple example, consider the election to the Australian parliament in 2016. In that year, election for both houses of Parliament (called the Senate and House of Representatives respectively) were held at the same time, but using two different voting systems. The results are shown in Figure 7.1.4, with each color representing a different political party.
(a)House of Representatives (150 members)
(b)Senate (76 members)
Figure7.1.4.Seats in the Australian Parliament, by party, after the 2016 election. Source 1
wikipedia.org
The Australian House is elected using instant runoff voting (IRV), which we will discuss in Section 7.2, and produced a small majority for the blue party. 2
Blue represents the Liberal-National Coalition, red is the Labor Party, green is the Green Party, yellow is One Nation, and orange is Centre Alliance. Purple represents independents and a number of minor parties with one seat each.
The Australian Senate, in contrast, is elected using a form of proportional representation, which led to more parties gaining seats and none with a majority. This happened even though both houses were chosen in the same election, with the same voters casting ballots. This is a dramatic example of how the result of an election depends on the voting system as much as on the choices of the voters, even in a democracy. 3
Specifically, the Senate is elected using a method called the single transferrable vote (STV).
Subsection7.1.2Plurality and Its Problems
Subsubsection7.1.2.1The Plurality Method
The voting method we’re most familiar with in the United States is the plurality method. We sometimes think of this as “majority rule”, but it is important to note that these two concepts are different (sometimes profoundly so).
Plurality versus Majority.
An alternative is said to have a plurality if it receives the largest number of votes.
In the plurality method, the alternative with the plurality of first-preference votes is declared the winner.
An alternative is said to have a majority if it is ranked first by greater than 50% of the voters.
Example7.1.5.
In Example 7.1.1 above, the first choice votes are 3 for Paris, 3 for Hawaii, and \(3+1=4\) for Colorado. Thus, the plurality winner of this election is Colorado.
However, Colorado does not have a majority. Colorado was ranked first by 4 out of 10 voters; that is, 40%. The other 60% would prefer to go somewhere other than Colorado.
In an election with only two candidates, the plurality candidate will also have a majority. This is not generally the case with more than two candidates. In the US, primary elections often have more than two candidates and thus routinely produce plurality winners who do not have majority support.
Example7.1.6.
The results of the 2018 Democratic primary election for Massachusetts’s 3rd Congressional district are shown in Table 7.1.7.
Table7.1.7.
Candidate
Percent of vote
Trahan
21.6
Koh
21.5
L’Italien
15.2
Matias
15.1
Gifford
15.1
Chandler
5.7
Four other candidates (plus write-ins)
5.8
In this election, Trahan was the plurality winner with 21.6% of the vote. She did not, however, have majority support; 78.4% of voters preferred someone else.
Exploration7.1.1.
Three candidates are running in an election for County Executive: Goings (G), McCarthy (M), and Bunney (B). The preference schedule is shown below. Which candidate wins under the plurality method? Does that candidate have a majority?
(Note: This data is loosely based on the 2008 County Executive election in Pierce County, Washington.)
Table7.1.8.
Number of voters (in thousands)
Rankings
44
14
20
70
22
80
39
1st choice
G
G
G
M
M
B
B
2nd choice
M
B
G
B
M
3rd choice
B
M
B
G
G
Solution.
The total number of voters is \(44+14+20+70+22+80+39=289\) thousand. For each candidate, the totals are:
Goings: \(44+14+20=78\) thousand
McCarthy: \(70+22=92\) thousand
Bunney: \(80+39=119\) thousand
Using the plurality system, Bunney wins with 119 thousand votes. This is about 41.2%—not a majority.
Subsubsection7.1.2.2Insincere Voting
Is it a problem when a plurality candidate does not have a majority? On the one hand, a large majority of voters would have preferred another candidate. On the other hand, if any other candidate were chosen as the winner instead, they would be opposed by an even larger majority!
To illustrate one problem with plurality voting (we will see more later), consider the following example.
Example7.1.9.
Suppose a certain city is choosing a mayor, and has three main political parties: Team Yellow, Team Purple, and Team Violet. Purple and Violet are fairly similar to each other: their voters would prefer either of them over Yellow. So, a preference table for this election might look like the following:
Table7.1.10.
Percent of voters
40%
35%
25%
1st choice
Yellow
Purple
Violet
2nd choice
Purple
Violet
Purple
3rd choice
Violet
Yellow
Yellow
If this election were held using plurality, then Yellow would be the winner. However, 60% of the city, who prefers either Purple or Violet over Yellow, will be unhappy with this result. In the next election, Violet voters might choose to vote for the Purple candidate, choosing the “lesser of two evils” to prevent Yellow from winning. We call this insincere voting. Over time, this process will likely cause the Violet party to die out, and the city will develop a two-party system.
Insincere voting is quite common in countries that use plurality elections. Even if many or most voters would prefer to be represented by many different parties, the plurality system makes it in their best interest to vote for one of the two main parties. This is why, for instance, there are only two significant parties in the US; other democracies which do not use the plurality system tend to have more than two major parties.
Subsubsection7.1.2.3Runoff Elections
Thinking in terms of voters’ entire preference lists, rather than just their first choices, can provide alternatives to plurality voting. Instead of just asking who everyone’s favorite candidate is, we can try to identify a candidate who, even if they aren’t everyone’s first choice, is broadly supported by a larger portion of the population.
One simple way of doing this is to have a second election, called a runoff election between just the top two candidates. Every voter would choose whichever of those two candidates they prefer (even if they didn’t vote for them in the first round). This way, the winning candidate will have a majority. Since there are two rounds of voting, this system is often called a two-round system.
Example7.1.11.
If the mayoral election in Example 7.1.9 used a two-round system, the runoff would be held between Yellow and Purple. Yellow would receive 40% of the vote, while Purple would receive \(35+25=60\%\) of the vote. Hence, Purple would win with a clear majority.
Runoff elections are used for primary elections in a number of US states. Additionally, the top-two primary system used for the Nebraska Legislature is essentially a two-round system. The primary election, in which all candidates compete in one nonpartisan election, functions as the first round. The general election, in which the top two candidates run against each other (whether they are of the same or different parties) functions as a runoff election.
Finally, it is worth mentioning that most (though not all) countries with a popularly elected president choose him or her using a two-round system, rather than plurality voting.
Subsection7.1.3Ranked Voting Systems and Fairness
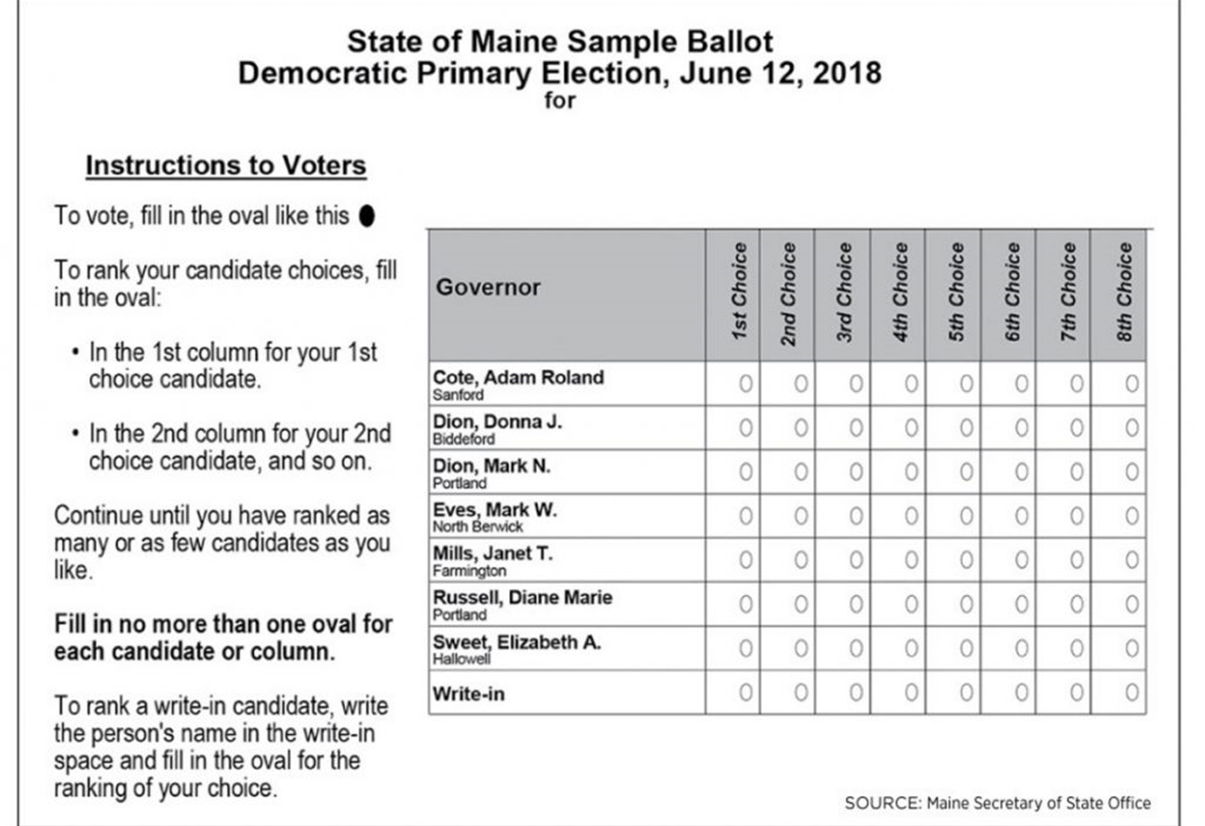
A runoff election, however, really only looks at voters’ first and second choices. We can do better by looking at voters’ entire preference lists, and that is what we will do for the rest of this chapter. We will consider several different voting methods in which voters’ entire preference lists are included in their ballot. Unlike runoff elections, there is no actual second election; instead, voters submit their entire preference list all on one ballot, ranking candidates in order of preference. We will sometimes, therefore, refer to these methods in general as ranked voting. An example of a ranked voting ballot is shown in Figure 7.1.12.
Figure7.1.12.Sample ballot for ranked choice voting in Maine
We will see that there are actually many different voting systems and, as mentioned above, they can produce very different results even given the same voters’ preferences. How can we evaluate which method is best?
Fairness Criteria.
A fairness criterion is a precise statement of a specific behavior that we expect to happen if an election is to be considered fair. (Note that “criterion” is the singular form, and “criteria” is the plural form.)
The mathematics of ranked voting will not give any magic answer as to which method is best, but it can give us tools to answer the question in an intelligent way. Instead of asking the question, “Which method is best” (which is imprecise and could easily depend on personal opinion), we can ask the question, “Does voting method X satisfy fairness criterion Y?” That is a question that can be answered objectively.
We will see that different methods satisfy different criteria, and in fact, no method will satisfy every criterion. Therefore, we still ultimately must use our judgement to assess which method we think is most fair overall. The mathematics of voting, however, lets us do so in a more thoughtful way.