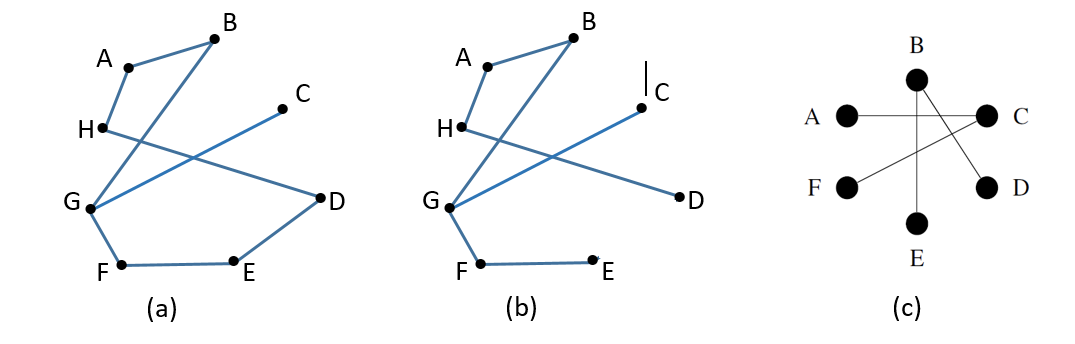
Which of the graphs in Figure 18.2.1 above are trees? Explain how you know.
Given the descriptions below, decide which of these options applies and explain your choice: (T) the graph is definitely a tree, (N) the graph is definitely not a tree, (M) the graph may or may not be a tree (more information is needed).
A network has 12 vertices and 13 edges.
A network has 12 vertices and 12 edges.
A network has 12 vertices and 12 bridges.
A network has 12 vertices and 11 edges.
A network has 12 vertices and at least 11 edges.
A network has 12 vertices and 11 bridges.
A network has 7 vertices (A through G) and there is only one path connecting A and G.
A network has 7 vertices, all of which have degree 2.
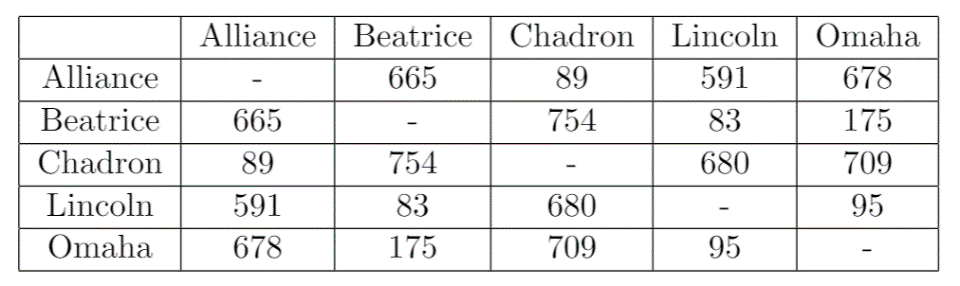
The table below gives the distance (in kilometers) between several cities in Nebraska. Use Kruskal’s algorithm to find a minimal spanning tree for these cities. Draw the tree and give its total weight.