Like most people, you probably feel that it is important to "take control of your life." But what does this mean? Partly it means being able to properly evaluate the data and claims that bombard you every day. If you cannot distinguish good from faulty reasoning, then you are vulnerable to manipulation and to decisions that are not in your best interest. Statistics provides tools that you need in order to react intelligently to information you hear or read. In this sense, statistics is one of the most important things that you can study.
To be more specific, here are some claims that we have heard on several occasions. (We are not saying that each one of these claims is true!)
4 out of 5 dentists recommend Dentyne.
Almost 85% of lung cancers in men and 45% in women are tobacco-related.
Condoms are effective 94% of the time.
Native Americans are significantly more likely to be hit crossing the streets than are people of other ethnicities.
People tend to be more persuasive when they look others directly in the eye and speak loudly and quickly.
Women make 75 cents to every dollar a man makes when they work the same job.
A surprising new study shows that eating egg whites can increase one’s life span.
People predict that it is very unlikely there will ever be another baseball player with a batting average over 400.
There is an 80% chance that in a room full of 30 people that at least two people will share the same birthday.
79.48% of all statistics are made up on the spot.
All of these claims are statistical in character. We suspect that some of them sound familiar; if not, we bet that you have heard other claims like them. Notice how diverse the examples are; they come from psychology, health, law, sports, business, etc. Indeed, data and data-interpretation show up in discourse from virtually every facet of contemporary life.
Statistics are often presented in an effort to add credibility to an argument or advice. You can see this by paying attention to television advertisements. Many of the numbers thrown about in this way do not represent careful statistical analysis. They can be misleading, and push you into decisions that you might find cause to regret. For these reasons, learning about statistics is a long step towards taking control of your life. (It is not, of course, the only step needed for this purpose.) These chapters will help you learn statistical essentials. It will make you into an intelligent consumer of statistical claims.
You can take the first step right away. To be an intelligent consumer of statistics, your first reflex must be to question the statistics that you encounter. The British Prime Minister Benjamin Disraeli famously said, "There are three kinds of lies -- lies, damned lies, and statistics." This quote reminds us why it is so important to understand statistics. So let us invite you to reform your statistical habits from now on. No longer will you blindly accept numbers or findings. Instead, you will begin to think about the numbers, their sources, and most importantly, the procedures used to generate them.
We have put the emphasis on defending ourselves against fraudulent claims wrapped up as statistics. Just as important as detecting the deceptive use of statistics is the appreciation of the proper use of statistics. Scientific research routinely makes statistical claims, and such research often influences the world significantly. Examples are common in the field of medicine. When a research team is testing a new treatment for a disease, statistics allows them to conclude based on a relatively small trial that there is good evidence their drug is effective. Social science is just as heavily statistical: for example, statistics allowed prosecutors in the 1950’s and 60’s to demonstrate racial bias existed in jury panels. We will learn to recognize statistical evidence that supports stated conclusions in studies such as these.
Statistics are all around you, sometimes used well, sometimes not. We must learn how to distinguish the two cases.
Subsection1.1.2Populations and Samples
Before we begin gathering and analyzing data we need to characterize the population we are studying. For example, if we want to study the amount of money spent on textbooks by a typical first-year college student, our population might be all first-year students at UNL. Or it might be:
All first-year students at some other college.
All first-year students at public colleges and universities in the state of Nebraska.
All first-year students at all colleges and universities in the state of Nebraska.
All first-year students at all colleges and universities in the entire United States.
And so on.
Population.
The population of a study is the group the collected data is intended to describe.
Sometimes the intended population is called the target population, since if we design our study badly, the collected data might not actually be representative of the intended population.
Why is it important to specify the population? We might get different answers to our question as we vary the population we are studying. First-year students at UNL might take slightly more diverse courses than those at a smaller college, and some of these courses may require less popular textbooks that cost more; or, on the other hand, the University Bookstore might have a larger pool of used textbooks, reducing the cost of these books to the students. Whichever the case (and it is likely that some combination of these and other factors are in play), the data we gather from UNL will probably not be the same as that from a smaller college. Particularly when conveying our results to others, we want to be clear about the population we are describing with our data.
Example1.1.1.
A newspaper website contains a poll asking people their opinion on a recent news article. What is the population?
While the target (intended) population may have been all people, the real population of the survey is readers of the website.
If we were able to gather data on every member of our population, say the average (we will define "average" more carefully in Section 2.2) amount of money spent on textbooks by each first-year student at your college during the 2009-2010 academic year, the resulting number would be called a parameter.
Parameter.
A parameter is a value (average, percentage, etc.) calculated using all the data from a population.
We seldom see parameters, however, since surveying an entire population is usually very time-consuming and expensive, unless the population is very small or we already have the data collected.
Census.
A survey of an entire population is called a census.
You are probably familiar with two common censuses: the official government Census that attempts to count the population of the U.S. every ten years, and voting, which asks the opinion of all eligible voters in a district. The first of these demonstrates one additional problem with a census: the difficulty in finding and getting participation from everyone in a large population, which can bias, or skew, the results.
There are occasionally times when a census is appropriate, usually when the population is fairly small. For example, if the manager of Starbucks wanted to know the average number of hours her employees worked last week, she should be able to pull up payroll records or ask each employee directly.
Since surveying an entire population is often impractical, we usually select a sample to study:
Sample.
A sample is a smaller subset of the entire population, ideally one that is fairly representative of the whole population.
We will discuss sampling methods in greater detail in Section 1.2. For now, let us assume that samples are chosen in an appropriate manner. If we survey a sample, say 100 first-year students at your college, and find the average amount of money spent by these students on textbooks, the resulting number is called a statistic.
Statistic.
A statistic is a value (average, percentage, etc.) calculated using the data from a sample.
Example1.1.2.
A researcher wanted to know how citizens of Omaha felt about a voter initiative. To study this, she goes to the Omaha Mall and randomly selects 500 shoppers and asks them their opinion. 60% indicate they are supportive of the initiative. What is the sample and population? Is the 60% value a parameter or a statistic?
The sample is the 500 shoppers questioned. The population is less clear. While the intended population of this survey was Omaha citizens, the effective population was mall shoppers. There is no reason to assume that the 500 shoppers questioned would be representative of all Omaha citizens.
The 60% value was based on the sample, so it is a statistic.
Exploration1.1.1.
To determine the average length of trout in a lake, researchers catch 20 fish and measure them. What is the sample and population in this study?
Solution.
The sample is the 20 fish caught. The population is all fish in the lake. The sample may be somewhat unrepresentative of the population since not all fish may be large enough to catch the bait.
Exploration1.1.2.
A college reports that the average age of their students is 21 years old. Is this a statistic or a parameter?
Solution.
This is a parameter, since the college would have to data on all students (the population)
Subsection1.1.3Estimating Populations
Once we have sampled a population, there are many kinds of data we can examine. Here, we will discuss two kinds of surveys that can estimate population statistics.
Subsubsection1.1.3.1One-sample estimation
You are probably already familiar with our first type of survey, called one-sample estimation. We’ll illustrate it using an example.
Example1.1.3.
Recall that in Example 1.1.2, a researcher surveyed 500 people in the Omaha Mall. Of those 500 people, 60% said they supported a certain voter initiative. If the population of Omaha is 450,000, then about how many of those people support this initiative?
We don’t know how accurate the sample is, but if we assume that these 500 people represent the city of Omaha, then we can guess that about 60% of the whole city supports the initiative, too. Thus, we find 60% of 450,000:
So, we estimate that about 270,000 people in Omaha support this voter initiative (provided that our sampling method was accurate).
That’s it! We can describe the steps of this method as follows.
We can use one-sample estimation to estimate the size of a smaller subpopulation within a larger population. Suppose that the overall population has \(P\) members and the subpopulation of interest has \(N\) members. We already know the value of \(P\text{;}\) we can find \(N\) as follows.
First, take one sample from the overall population, and count how many members of the sample are part of the subpopulation of interest. Call that number \(k\text{.}\)
Suppose the sample has \(S\) members. Find the proportion of the sample that is also in the subpopulation: that is, \(k/S\text{.}\)
Multiply the proportion, \(k/S\text{,}\) by the total population, \(P\text{,}\) to estimate the value of \(N\text{,}\) the total number of members of the subpopulation.
Notice that the key assumption of one-sample estimation occurs in the last step above: we assume that the subpopulation is the same proportion of the sample as it is of the overall population. In the case of Example 1.1.3, this means that we assumed that because 60% of the people we interviewed supported the initiative, about 60% of the whole city probably supports the initiative, too. This assumption depends strongly on the quality of our sample, which we will discuss more thoroughly in Section 1.2.
Subsubsection1.1.3.2The mark-recapture method
One-sample estimation assumes that we know the value of a large population, and then lets us find the size of a subpopulation. There are many situations, however, where the overall population itself is the unknown quantity we wish to determine. How can we do that?
One obvious solution is to conduct a census: that is, to directly count every member of the population. This method, however, has clear practical difficulties, especially if the population in question is large, widely dispersed, or hard to access. For example, suppose a state park wants to count all the deer in their territory. How could they ensure they have found all the deer, and also avoid double-counting?
One solution to this problem is called the mark-recapture method. It uses two samples to obtain an estimate of the population. We will describe it using the language of counting an animal population, but the same process can be applied to any enumeration problem. Let’s demonstrate it using an example.
Example1.1.4.
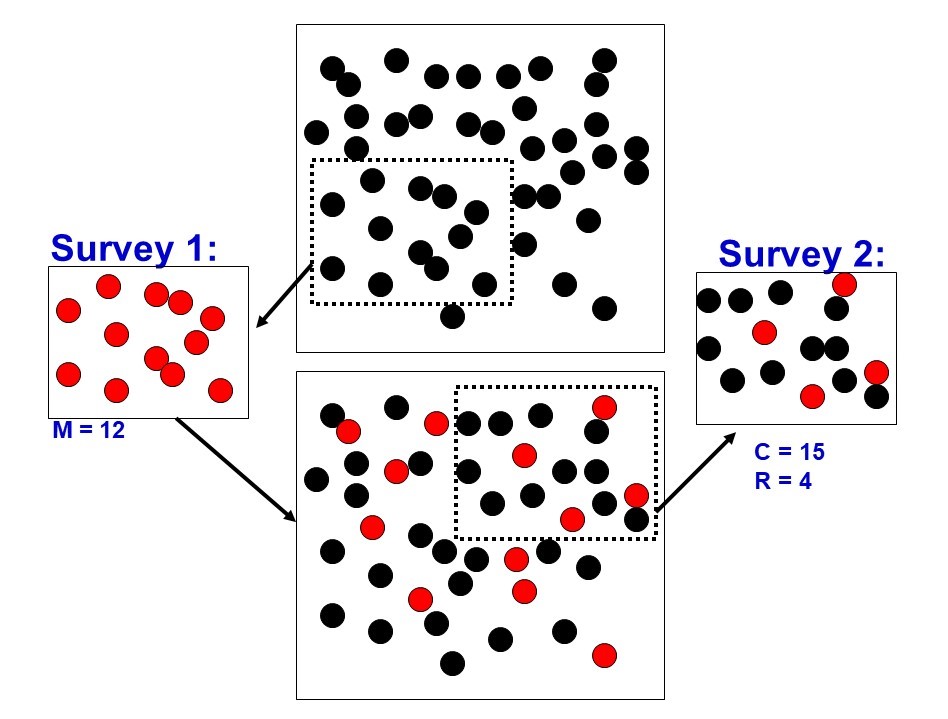
Suppose we are trying to find the size of a population, represented by the the black dots in the top box of Figure 1.1.5. This number, represented by \(N\text{,}\) is currently unknown.
Figure1.1.5.Illustration of the mark-recapture enumeration method. This diagram was created by Diane Srivastava, Professor Dept of Zoology and Biodiversity Research Centre, University of British Columbia.
We first take a sample of 12 individuals and mark them (assign them the variable \(M=12\text{,}\) for “marked”). They are represented by the red dots in the box labeled “Survey 1”. These individuals are then returned to the original population and allowed to mix with the unmarked members, represented by the box of both black and red dots at the bottom of Figure 1.1.5.
Next, we remove a second sample, represented by the box on the right. This sample contains fifteen total members (\(C=15\text{,}\) for “captured”), some marked and some unmarked. Of these 15 members, a total of \(R=4\) have been marked (called \(R\) for “recaptured”). Since \(4/15\approx 0.267\text{,}\) about 26.7% of the second sample is marked.
The key to the mark-recapture method is that we now assume that about 26.7% of the total population (\(N\)) is also marked. Since we began by allowing the marked individuals to mix with the overall population, we can reasonably expect this assumption to hold. 1
Below, we will discuss how failure of this assumption can be a source of error.
We know that we originally marked a total of 12 individuals, so 12 must be about 26.7% of the unknown value, \(N\text{.}\) This gives us the equation:
\begin{equation*}
12\approx 0.267\cdot N
\end{equation*}
This is no different than what we just did above, but it allows us to perform the whole process in a single step.
We can collect the steps we’ve just performed into the following set of general directions for the mark-recapture method.
The mark-recapture method of enumeration.
We are looking to find the total size of a population, which is an unknown number \(N\text{.}\) First, capture and count two samples according to the following process:
Catch a number, \(M\text{,}\) of animals (the first sample), and mark them in some way.
Release the captured animals into the wild and allow them to mix with the general population.
After a period of time has passed, capture a second group of animals. This is the second sample; denote its population value \(C\text{.}\)
Some of the \(C\) many animals in the second sample will have been previously marked, and some won’t. Call the number of them that have been marked \(R\) (for “recapture”, since these are the animals that have been captured in both samples).
Now we assume that the proportion of marked animals in our second sample is about the same as the proportion of marked animals in the overall population. In other words,
Suppose state park officials are studying the local deer population. They capture and mark 228 deer, which they release back into the park. After a month, they capture a sample of 255 deer, of which 11 have been previously marked. Use these figures to estimate the deer population of the park.
Using the variable names defined above, \(M=228\text{,}\)\(C=255,\) and \(R=11\text{.}\) Our formula tells us that:
Since we can’t have 0.45 of a deer, we round to the nearest whole number, and find that the park has about 5285 deer.
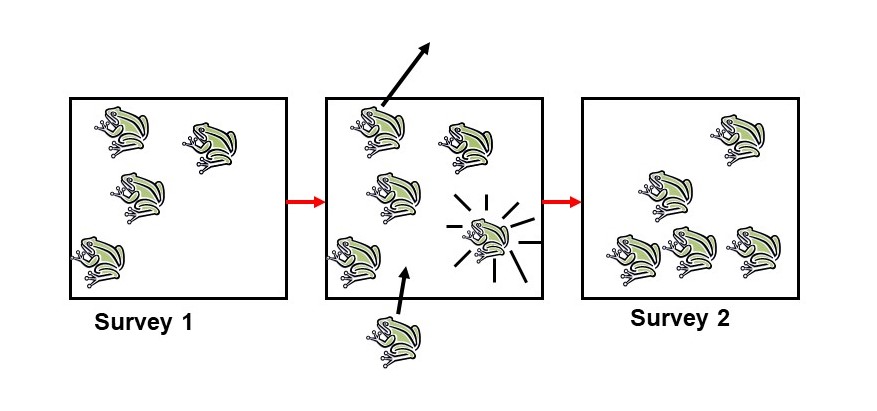
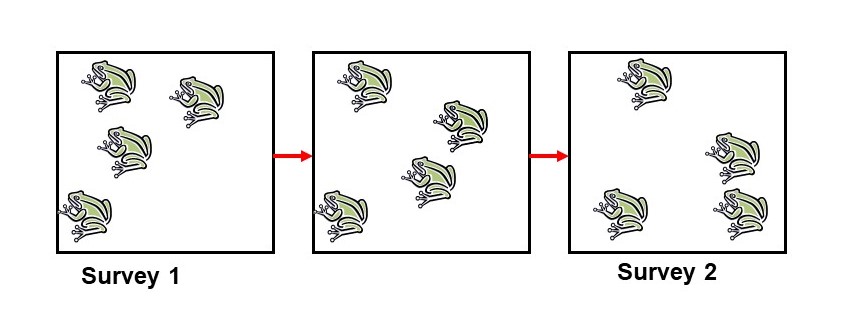
As with all estimation methods, a number of factors can impact the accuracy of the mark-recapture method. One of the most important is the difference between open and closed populations. An open population is one in which individuals enter or exit the population between the first and second survey. This could mean physically entering or leaving the region, or it could mean birth and death. On the other hand, a closed population is one in which individuals do not enter or exit a population between the two surveys.
Figure1.1.7.Open Population. This diagram was created by Diane Srivastava, Professor Dept of Zoology and Biodiversity Research Centre, University of British Columbia.
Figure1.1.8.Closed Population. This diagram was created by Diane Srivastava, Professor Dept of Zoology and Biodiversity Research Centre, University of British Columbia.
The mark-recapture method is more accurate when a population is more closed than open. Since we are measuring the population between two surveys taken at two different times, we want the population to be as similar as possible between those two times. Some factors that help make a population more closed include physical barriers, large survey areas, slow rates of reproduction and death, and a shorter time between surveys. For example, a population surveyed in a lake will be more closed than one in a small field.
There are other sources of inaccuracy, too. We can determine how they affect the count by considering how they impact the values of \(M\text{,}\)\(C\text{,}\) or \(R\text{.}\) Since our approximation formula is \(N\approx \frac{MC}{R}\text{,}\) increases in \(M\) and \(C\) should cause overestimates, while increases in \(R\) should cause underestimates. On the other hand, a low value of \(R\) will cause an overestimate.
Table1.1.9.
Source of error
Effect
Marks fall off
Decreases \(R\text{,}\) causing an overestimate
Marked animals more likely to be recaptured
Increases \(R\text{,}\) causing an underestimate
(for instance, if the marks incapacitate them)
Marked animals likely to die
Decreases \(R\text{,}\) causing an overestimate
Not enough time for mixing between surveys
Could either increase or decrease \(R\)
Notice that there are some tradeoffs. For example, if we allow too little time between surveys, the population won’t have enough time to mix. But if we allow too much time, more members are likely to leave the population (from death or migration) which would make the population more open. Also notice that some of these errors can be avoided by good experimental design—for example, choosing markings that do not harm or even kill the animal. On the other hand, there may be some situations, like a very open population, in which the mark-recapture method may not be as accurate even if it is conducted well.
The mark-recapture method is just one technique of many used by scientists to study populations. By keeping possible sources of error in mind and designing their studies carefully, they can achieve a good level of accuracy. One interesting example of this is the US Census.
Every ten years, the US government conducts a census of the population as required by the Constitution. US law states that the actual census data — that is, the count of every single person — be used as the official count (for instance, to apportion seats in the House of Representatives). However, not only is it difficult and expensive to count every person in the US directly, but it can even be less accurate than enumeration by sampling. In fact, the Census Bureau does a version of the mark-recapture procedure after each census, and uses that figure to estimate the error of the less accurate official tally. They describe this process at the following page: “How do we conduct a post-enumeration survey? 2