Nathan Wakefield, Christine Kelley, Marla Williams, Michelle Haver, Lawrence Seminario-Romero, Robert Huben, Aurora Marks, Stephanie Prahl, Based upon Active Calculus by Matthew Boelkins
Subsection1.3Functions Defined by Graphs
A graph may also be used to define one variable as a function of another. The input variable is displayed on the horizontal axis, and the output variable on the vertical axis.
Example1.5
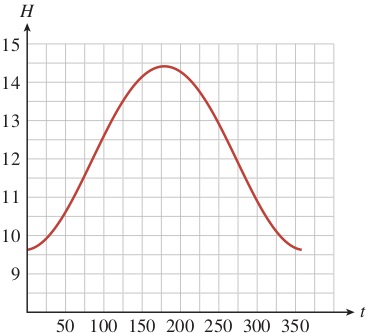
Figure1.6 shows the number of hours, \(H\text{,}\) that the sun is above the horizon in Peoria, Illinois, on day \(t\text{,}\) where January 1 corresponds to \(t = 0\text{.}\)
The input variable, \(t\text{,}\) appears on the horizontal axis. The number of daylight hours, \(H\text{,}\) is a function of the date. The output variable appears on the vertical axis.
The point on the curve where \(t = 150\) has \(H \approx 14.1\text{,}\) so Peoria gets about 14.1 hours of daylight when \(t = 150\text{,}\) which is at the end of May.
\(H = 12\) at the two points where \(t \approx 85\) (in late March) and \(t \approx 270\) (late September).
The maximum value of 14.4 hours occurs on the longest day of the year, when \(t \approx 170\text{,}\) about three weeks into June. The minimum of 9.6 hours occurs on the shortest day, when \(t \approx 355\text{,}\) about three weeks into December.
Figure1.6
We have a method of quickly determining if a relationship is a function once we have a graph of the relationship.
The Vertical Line Test
A graph represents a function if and only if every vertical line intersects the graph in at most one point.
Figure1.7Demonstration of the Vertical Line Test
Example1.8
Use the vertical line test to decide which of the graphs in Figure1.9 represent functions.
Graph (a) represents a function, because it passes the vertical line test.
Graph (b) is not the graph of a function, because the vertical line at (for example) \(x = 1\) intersects the graph at two points.
For graph (c), notice the break in the curve at \(x = 2\text{:}\) The solid dot at \((2, 1)\) is the only point on the graph with \(x = 2\text{;}\) the open circle at \((2, 3)\) indicates that \((2, 3)\) is not a point on the graph. Thus, graph (c) is a function, with \(f(2) = 1\text{.}\)