Kevin Gonzales, Eric Hopkins, Catherine Zimmitti, Cheryl Kane, Modified to fit Applied Calculus from Coordinated Calculus by Nathan Wakefield et. al., Based upon Active Calculus by Matthew Boelkins
What are some properties of definite integrals, and how can we use these to evaluate given integrals?
How is the average value of a function on an interval related to the definite integral of that function on the interval?
How can we find the area between two curves?
This section corresponds to 4.5 Properties of Integration in the workbook.
Subsection5.4.1Some properties of the definite integral
Regarding the definite integral of a function \(f\) over an interval \([a,b]\) as the net signed area bounded by \(f\) and the \(x\)-axis, we discover several standard properties of the definite integral.
For any real number \(a\) and the definite integral \(\displaystyle \int\limits_a^a f(x) \, dx\text{,}\) it is evident that no area is enclosed because the interval begins and ends with the same point. Hence, we have our first property of definite integrals:
If \(f\) is a continuous function and \(a\) is a real number, then \(\displaystyle \int\limits_a^a f(x) \,dx = 0\text{.}\)
Next, we consider the result of subdividing the interval of integration. In Figure 5.4.1, we see that
Another property of the definite integral states that if we reverse the order of the limits of integration, we change the sign of the integral’s value.
If \(f\) is a continuous function and \(a\) and \(b\) are real numbers, then
Subsection5.4.2How the definite integral is connected to a function’s average value
One of the most valuable applications of the definite integral is that it provides a way to discuss the average value of a function, even for a function that takes on infinitely many values. Recall that if we wish to take the average of \(n\) numbers \(y_1\text{,}\)\(y_2\text{,}\)\(\ldots\text{,}\)\(y_n\text{,}\) we compute
Since integrals arise from Riemann sums in which we add \(n\) values of a function, it should not be surprising that evaluating an integral is similar to averaging the output values of a function.
Average value of a function.
If \(f\) is a continuous function on \([a,b]\text{,}\) then its average value on \([a,b]\) is given by the formula
Subsection5.4.3Integration and the Area between Two Curves
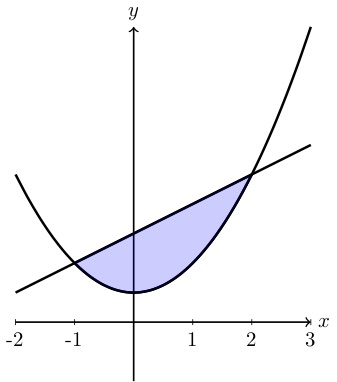
Integration allows us to find the area between a curve and the \(x\)-axis. In fact, by visually inspecting the graphs of two different curves we can develop a technique for finding the area between two curves. Consider the graphs of the curves \(y=x^2+1\) and \(y=x+3\) displayed in Figure 5.4.7. We might ask if there is a way to find the area enclosed by these two curves as is colored in the figure.
Figure5.4.7.Graphs of the curves \(y=x^2+1\) and \(y=x+3\text{.}\)
In fact, using the knowledge we have about integration, we can figure out this quantity exactly.
Example5.4.8.
What is the exact area enclosed by the curves given by the functions \(f(x)=x^2+1\) and \(g(x)=x+3\text{?}\)
The first step in solving this problem is to determine where the curves intersect. We can find the point of intersection by setting the two curves equal to each other.
Therefore, the curves intersect at two \(x\)-values, \(x=-1,2\text{.}\) This means were are concerned with the interval \([-1,2]\text{.}\)
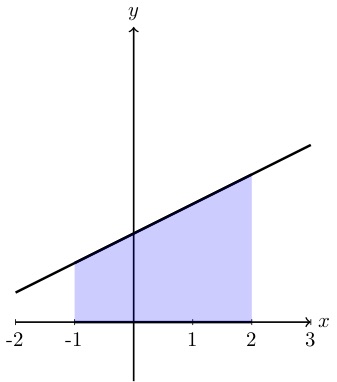
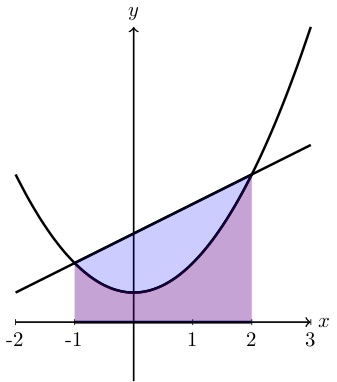
We next note that on the interval in question, \([-1,2]\text{,}\) the curve \(g(x)=x+3\) is above the curve \(f(x)=x^2+1\text{.}\) We also note that \(\displaystyle \int\limits_{-1}^{2}(x+3)dx\) would give the area shown in Figure 5.4.9 and \(\displaystyle \int\limits_{-1}^{2}(x^2+1)dx\)Figure 5.4.10.
Figure5.4.9.Graph of the curve \(y=x+3\text{.}\)
Figure5.4.10.Graph of the curve \(y=x^2+1\text{.}\)
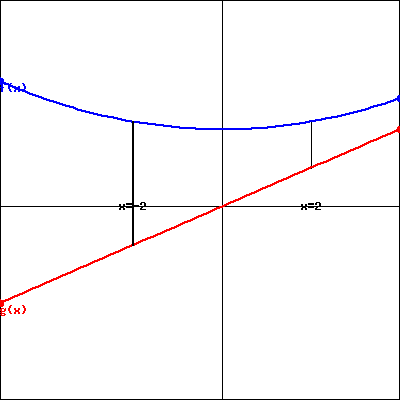
Find the area of the region enclosed between \(f(x)=0.1x^2+4\text{,}\) shown as the red curve in the image below, and \(g(x)=x\text{,}\) shown as the blue curve in the figure below, between \(x=−2\text{,}\) and \(x=2\text{.}\)
Figure5.4.13.Graphs of the curves \(f(x)=0.1x^2+4\) and \(g(x)=x\text{.}\)
Answer.
The area between \(f(x)\) and \(g(x)\) is \(16.5333\text{.}\)
Solution.
Here we are given the interval of integration, \([-2,2]\text{,}\) so we integrate:
Thus, these two curves intersect at \(x=\pm1\text{.}\) This gives us the bounds of integration. Now we need to determine which curve is the top curve. To do so, plug in a value between the bounds, for example, \(x=0\text{.}\) From this we see that \(y=x^2+3\) is the top curve. So the area between the curves can be determined by the integral:
We have explored several properties of definite integrals, such as the integral over the interval \([a,a] \text{,}\) subdividing the interval of integration, and reversing the order of the limits of integration. These properties help us to evaluate integrals of functions that may otherwise be difficult to evaluate, such as piecewise functions.
One of the most valuable applications of the definite integral is that it provides a way to discuss the average value of a function. Indeed, if \(f \) is a continuous function on \([a,b] \text{,}\) then its average value on \([a,b] \) is given by the formula \(f_{\operatorname{AVG} [a,b]} = \frac{1}{b-a} \int_a^b f(x) \,dx
\text{.}\)
Integration also allows us to find the area between two curves. For example, if \(f(x)\ge g(x)\) on the interval \([a,b]\text{,}\) then the area between \(f(x)\) and \(g(x)\) is \(\int\limits_a^b \left(\text{top curve-bottom curve}\right) dx =\int\limits_a^b (f(x)-g(x))dx.\)
Exercises5.4.5Exercises
1.Finding the average value of a linear function.
Find the average value of \(f(x)=5 x + 2\) over \([4,7]\)
average value =
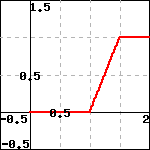
2.Finding the average value of a function given graphically.
The figure below to the left is a graph of \(f(x)\text{,}\) and below to the right is \(g(x)\text{.}\)
\(f(x)\)
\(g(x)\)
(a)
What is the average value of \(f(x)\) on \(0\le x\le 2\text{?}\)
avg value =
(b)
What is the average value of \(g(x)\) on \(0\le x\le 2\text{?}\)
avg value =
(c)
What is the average value of \(f(x)\cdot g(x)\) on \(0\le x\le 2\text{?}\)
PTX:ERROR: WeBWorK problem UNL-Problems/104-Problems/properties_def_integrals2.pg with seed 162 does not have a statement tag Maybe it uses something other than BEGIN_TEXT or BEGIN_PGML to print the statement in its PG code Use -a to halt with returned content
6.Area between two curves.
Find the area of the region enclosed by the graphs of the two functions \(y=3 x^2\) and \(y=x^2 + 2 .\)
Area =
(Round to three decimal places as needed.)
Note:You can click on the graph to enlarge the image.
Hint.
First set the two curves equal to each other and solve for the two points of intersection. These two points will be the bounds of integration.
Second determine the top and bottom curves by testing the value of the two functions at a point in-between the two points found in the first step. (Here test at \(x=0\text{.}\))
Finally integrate top curve minus bottom curve over the interval found above.
7.Using the Sum and Constant Multiple Rules.
Consider the graphs of two functions \(f\) and \(g\) that are provided in Figure 5.4.16. Each piece of \(f\) and \(g\) is either part of a straight line or part of a circle.
Figure5.4.16.Two functions \(f\) and \(g\text{.}\)
Determine the exact value of \(\int_0^1 [f(x) + g(x)]\,dx\text{.}\)
Determine the exact value of \(\int_1^4 [2f(x) - 3g(x)] \, dx\text{.}\)
Find the exact average value of \(h(x) = g(x) - f(x)\) on \([0,4]\text{.}\)
For what constant \(c\) does the following equation hold?
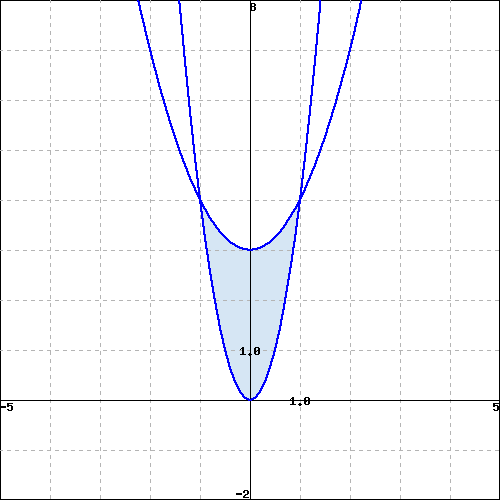
Let \(f(x) = 3 - x^2\) and \(g(x) = 2x^2\text{.}\)
On the interval \([-1,1]\text{,}\) sketch a labeled graph of \(y = f(x)\) and write a definite integral whose value is the exact area bounded by \(y = f(x)\) on \([-1,1]\text{.}\)
On the interval \([-1,1]\text{,}\) sketch a labeled graph of \(y = g(x)\) and write a definite integral whose value is the exact area bounded by \(y = g(x)\) on \([-1,1]\text{.}\)
Write an expression involving a difference of definite integrals whose value is the exact area that lies between \(y = f(x)\) and \(y = g(x)\) on \([-1,1]\text{.}\)
Explain why your expression in (c) has the same value as the single integral \(\int_{-1}^1 [f(x) - g(x)] \, dx\text{.}\)
Explain why, in general, if \(p(x) \ge q(x)\) for all \(x\) in \([a,b]\text{,}\) the exact area between \(y = p(x)\) and \(y = q(x)\) is given by