\(\newcommand{\dollar}{\$} \DeclareMathOperator{\erf}{erf} \DeclareMathOperator{\arctanh}{arctanh} \newcommand{\lt}{<} \newcommand{\gt}{>} \newcommand{\amp}{&} \)

Subsection3.4Generalized Trigonometric Functions

Like all functions, trigonometric functions can be transformed by changing properties like the period, midline, and amplitude of the function. In this subsection, we explore transformations of the sine and cosine functions and use them to model real life situations.

Transformations of Sine and Cosine

Given an equation in the form

\begin{equation*} f(t) = A\sin(Bt)+k \hspace{.25in} \text{ or } \hspace{.25in} g(t) = A\cos(Bt)+k \end{equation*}

\(|A| \ \) is the vertical stretch/compression and the amplitude of the function.

\(|B| \ \) is the horizontal stretch/compression and is related to the period of the function, \(P\text{,}\) by the formula

\begin{equation*} P=\frac{2\pi}{|B|} \end{equation*}

\(k \ \) is the vertical shift and determines the midline of the function.

Example3.43

Sketch a graph of the function

\begin{equation*} g(t)=3\sin(2t)+4 \end{equation*}
Solution

To begin, let's find the period, midline, and amplitude of the function.

Using the relationships above, the stretch/compression factor is \(|B|=|2|\text{.}\) Therefore, the period is

\begin{equation*} P = \frac{2\pi}{|B|} = \frac{2\pi}{|2|} = \pi \end{equation*}

The vertical stretch/compression factor is \(|A|=|3|=3\text{,}\) so the amplitude is 3.

Finally, the vertical shift of the function is \(k=4\text{,}\) so the midline of the function is

\begin{equation*} y=4 \end{equation*}

Using our knowledge of the graph of \(f(t)=\sin(t)\text{,}\) we can sketch a transformed graph of \(g(t)=3\sin(2t)+4\text{.}\) Note that the period, midline and amplitude of both functions is different. Thus, the graph of \(g(t)=3\sin(t)+4\) involves a vertical shift up by 4, a vertical stretch of 3, and a horizontal compression by a factor of \(\frac{1}{2}\) from the original graph of \(f(t)=\sin(t)\text{.}\) The graph of \(g(t)=3\sin(2t)+4\) is shown below.

graph of 3sin(2t)+4
Example3.44

Determine the midline, amplitude, and period and sketch a graph of the function

\begin{equation*} f(t)=2\cos\left(\frac{\pi}{4}t\right)+1 \end{equation*}
Solution

To begin, let's find the period, midline, and amplitude of the function.

Using the relationships above, the stretch/compression factor is \(|B|=|\frac{\pi}{4}|\text{.}\) Therefore, the period of the function is

\begin{equation*} P = \frac{2\pi}{|B|} = \frac{2\pi}{|\pi/4|} = 2\pi \cdot \frac{4}{\pi} = 8 \end{equation*}

The vertical stretch/compression factor is \(|A|=|2|=2\text{,}\) so the amplitude of the function is 2.

Finally, the vertical shift of the function is \(k=1\text{,}\) so the midline of the function is

\begin{equation*} y=1 \end{equation*}

Using our knowledge of the graph of \(g(t)=\cos(t)\text{,}\) we can sketch a transformed graph of

\begin{equation*} f(t)=2\cos\left(\frac{\pi}{4}t\right)+1\text{.} \end{equation*}

Note that the period, midline and amplitude of both functions is different. Thus, the transformed graph involves a vertical shift up by 1, a vertical stretch of 2, and a horizontal stretch by a factor of \(\frac{4}{\pi}\) from the original graph of \(g(t)=\cos(t)\text{.}\) Shown below is the graph of the transformed function

\begin{equation*} f(t)=2\cos\left(\frac{\pi}{4}t\right)+1 \end{equation*}
graph of 2cos(pi/4t)+1

Transforming the amplitude, midline, and period of sinusoidal functions, along with vertical and horizontal reflections, allow us to write equations for a variety of periodic situations.

Example3.45

Find a formula for the sinusoidal function graphed below.

graph of -2cos(2pi/5t)+2
Solution

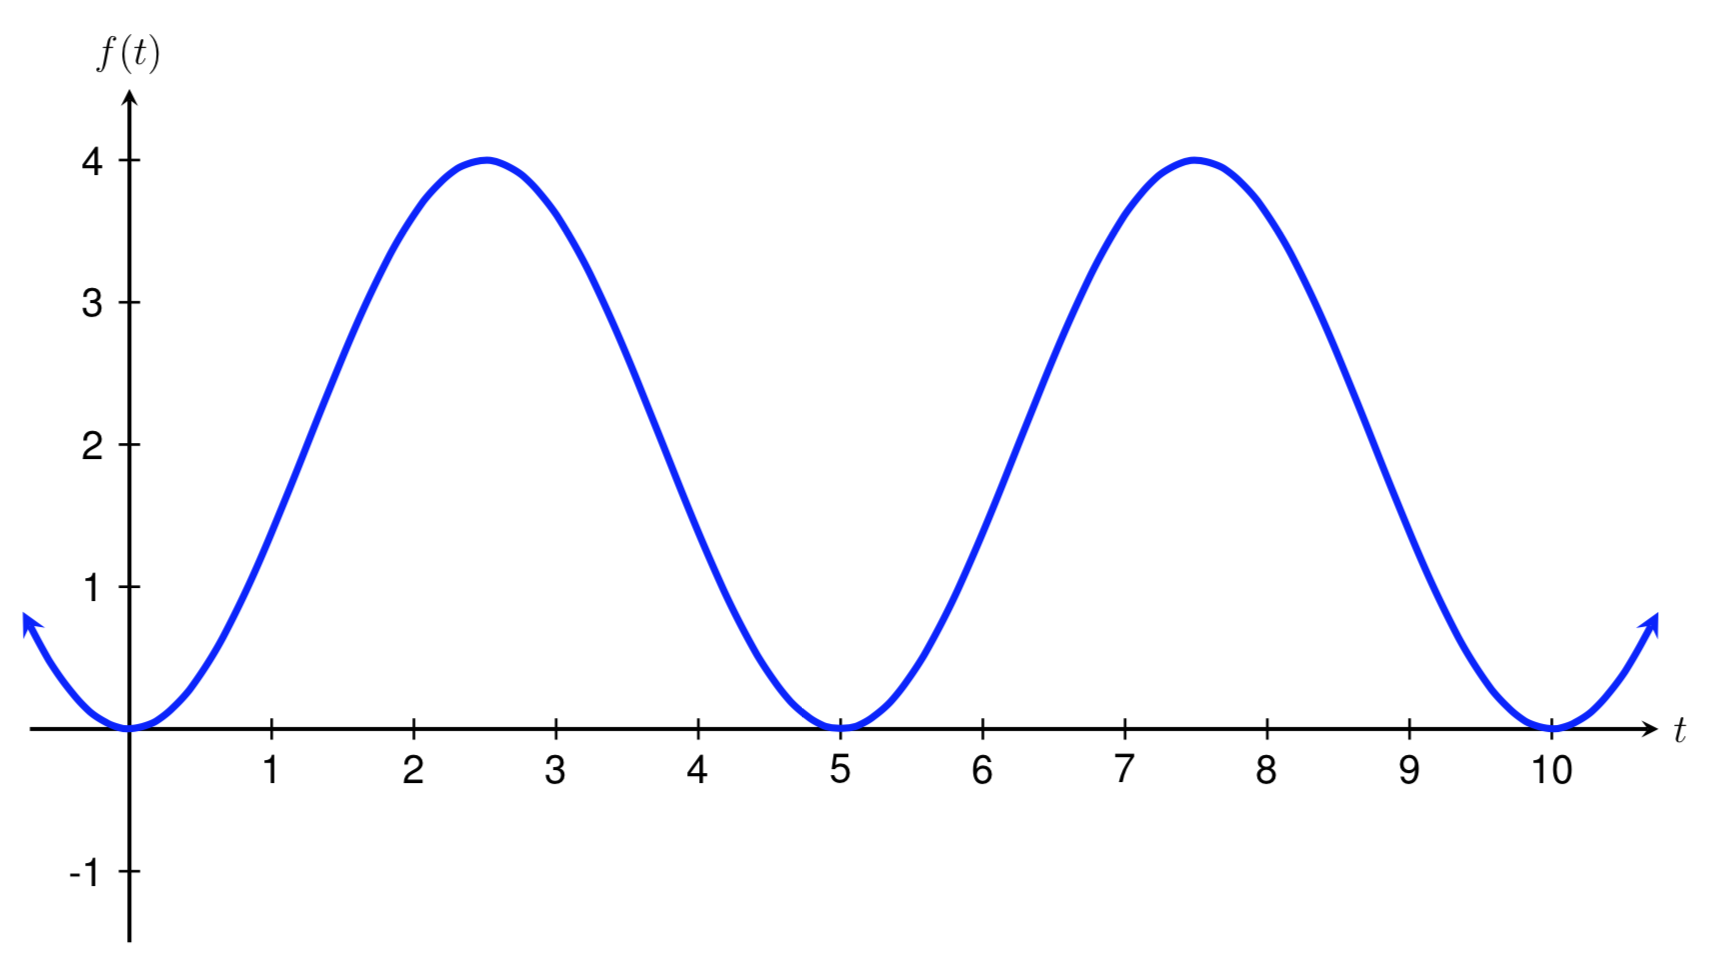
To begin, let's find the period, midline, and amplitude of the function graphed above.

Recall that the period of the function is how long it takes for the function to start repeating. If we think about the function "starting" at \(x=0\text{,}\) or when it crosses the \(y\)-axis, we can see that the function above begins repeating when \(x=5\text{.}\) Therefore, the period of the function graphed above is 5.

Since the period of a function is related to \(B\text{,}\) the stretch/compression factor, we can use the relationship \(P = \frac{2\pi}{|B|}\) to solve for \(B\text{.}\) Substituting 5 in for \(P\text{,}\) we get

\begin{align*} 5 \amp= \frac{2\pi}{|B|} \\ \\ |B| \cdot 5 \amp= 2\pi \\ \\ |B| \amp= \frac{2\pi}{5} \end{align*}

For now, we can assume that the \(B\) value is positive, which gives us

\begin{equation*} B = \frac{2\pi}{5} \end{equation*}

The midline of the function is the horizontal line halfway between the function's maximum and minimum values. Here, the maximum value of the function is 4 and the minimum value is 0. The number halfway between 4 and 0 is 2, so the midline is the line \(y=2\text{.}\) Therefore, the vertical shift of the function graphed above is

\begin{equation*} k=2 \end{equation*}

Finally, the amplitude of the function is the distance between the function's maximum value and the midline. The distance between the function's maximum value of 4 and the function's midline of \(y=2\) is 2, so the amplitude of the function above is 2. Therefore, the vertical stretch factor is

\begin{equation*} |A|=2 \end{equation*}

We now need to decide what type of sinusoidal function to use and whether \(A\) is positive or negative. Note that the function shown above crosses the \(y\)-axis at its minimum value. Therefore, from our work above, we need to use a vertical reflection of a cosine graph to model this function, which means that

\begin{equation*} A=-2 \end{equation*}

Using our work above and substituting our known values into the generalized cosine function \(g(t)=A\cos(Bt) + k\) gives us the following formula for the function graphed above.

\begin{equation*} f(t) = -2\cos\left(\frac{2\pi}{5}t\right) + 2 \end{equation*}

To check our solution, we can use a graphing calculator to graph the function we came up with and confirm that it matches the graph shown above.

Example3.46

The London Eye is a huge Ferris wheel in London, England. It completes one full rotation every 30 minutes, and the diameter of its passenger capsules is 130 meters. Riders board the passenger capsules from a platform that is 5 meters above the ground. At time \(t=0\text{,}\) an individual boards the Ferris wheel.

Find a formula for \(h=f(t)\text{,}\) where \(h\) is the height of the individual above ground (in meters) after \(t\) minutes.

Solution

Recall that in the London Eye example, we sketched a graph of \(h=f(t)\) for the situation described above. This graph is shown below.

London Eye Graph

Since we have already sketched a graph of this function, we can use this graph to construct a formula for this function.

As shown on the graph, the period of the function is 30 minutes. Therefore, the \(B\) value of the function is

\begin{equation*} |B| = \frac{2\pi}{P} = \frac{2\pi}{30} = \frac{\pi}{15} \end{equation*}

Again, we assume that \(B\) is positive, so

\begin{equation*} B=\frac{\pi}{15} \end{equation*}

The maximum value of the function is 135 meters and the minimum value is 5 meters. The midline is halfway in between these two values and can be found by averaging them:

\begin{equation*} \frac{135+5}{2} = \frac{140}{2} = 70 \text{ meters} \end{equation*}

Thus, the midline of the function is the line \(y=70\) meters, and

\begin{equation*} k=70 \end{equation*}

The amplitude of the function is the distance between the maximum value and the midline which is \(135-70=65\) meters. Therefore,

\begin{equation*} |A|=65 \end{equation*}

Finally, we need to determine what type of function to use and whether the \(A\) value is positive or negative. Since the graph of the function crosses the \(y\)-axis at its minimum value, we can use a negative cosine graph to represent this function. Therefore,

\begin{equation*} A=-65 \end{equation*}

Using our work above and substituting our known values into the generalized cosine function \(g(t)=A\cos(Bt) + k\) gives us the following formula for \(h=f(t)\)

\begin{equation*} f(t) = -65\cos\left(\frac{\pi}{15}t\right) + 70 \end{equation*}

To check our solution, we can use a graphing calculator to graph the function we came up with and confirm that it matches the graph shown above.